Quantcast
Channel: SQL Server – performance and other stories
Viewing all 94 articles
Browse latest View live

Choosing an efficient clustered key - Other side of the moon

$
0
0
Other side of the moon
Choosing an efficient clustered key is a crucial factor of good database performance. However this factor is often neglected during database schema design time leading to poor performance. It also becomes difficult to resolve issues when the database grows into multi-terabytes in size and even using huge hardware will not reach the satisfactory performance goal.

What is a Clustered Key?
“Clustered indexes sort and store the data rows in the table based on their key values. There can only be one clustered index per table, because the data rows themselves can only be sorted in one order”. To improve performance, reducing the IO overhead is necessary to have a clustered key on almost all tables in a high transactional database. Although there are numerous guidelines and good practices that are available to understand the necessity of an appropriate clustered in a table; the question is how often do we consider those practices while choosing a clustered key?


It is generally advisable that a clustered key should be the one which is narrow in length and has a unique value column (such as primary key). If the column is not unique then Database Engine will add a 4-byte uniqueifier value to each row to make the column unique. This added value is internal and can’t be seen or accessed by the user and has some internal overhead. However, the more inefficiency occurs when the clustered key is wider than needed.

Pitfall of in-efficient clustered key:
1.      Fragmentation: Rapidly introduces more fragmentation.
2.      Page Split: A huge number of page allocations and de-allocations happen.
3.      Space:Requires more disk & memory, and IO cost will be high.
4.      CPU Usage: Observe high CPU due to excessive page split.
5.      Slowness: Query response time decreases.
6.      Optimization: Index optimization requires more time.

Good Clustered Key:
1.      A unique key column is the best candidate for a clustered key.
2.      IDENTITY column is a good choice as they are sequential.
3.      The column which is used on a JOIN clause.
4.      The column used to retrieve data sequentially.
5.      The column used in SORT (GROUP or ORDER) operation frequently.
6.      Frequently used in range scan (such as BETWEEN, >=, =< )
7.      Static Column: such as EmployeeID, SSN.

In-efficient choice for clustered key:
1.      Wide Keys: multi-columns key. Such as LastName + FirstName + MiddleName or Address1 + Adddress2 + Phone, so on. “The key values from the clustered index are used by all non-clustered indexes as lookup keys. Any non-clustered indexes defined on the same table will be significantly larger because the non-clustered index entries contain the clustering key and also the key columns defined for that non-clustered index.
2.      GUID:Randomly generated unique values leads to highest possible fragmentation. NEWSEQUENTIALID() can be used  instead of NEWID() to create GUID to reduce fragmentation in a table.
3.      Data Changes: The column which has frequent value change is not a good choice for a clustered key.

Narrow vs. Wide Clustered Key Test:
Here we will be observing how a wide clustered key introduces performance issues. In our example,
(a)   “xID” is the Clustered Key which is a Primary Key and an Identity column.
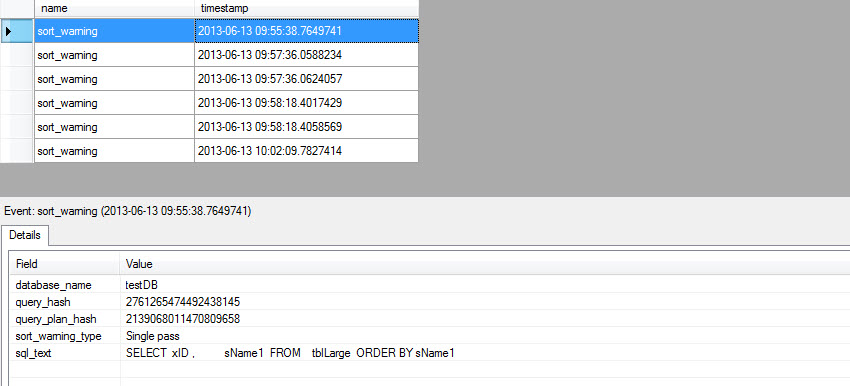
(b)   Later we will create a multi-column clustered key by using “sName1”, “sName2” and “sName3” which are varchar columns.
(c)    We will insert 100,000 rows for this test
(d)   We will review fragmentation and page split for type of indexes.

DMV Query:
--To check table and index level changes:
SELECT  OBJECT_NAME(ios.object_id,ios.database_id)astable_name,
              ios.index_id,
        si.nameASindex_name,
        ios.leaf_insert_count+
        ios.leaf_update_count+
        ios.leaf_delete_countASleaf_changes,
        ios.leaf_allocation_countASleaf_page_splits,
        ios.nonleaf_insert_count+
        ios.nonleaf_update_count+
        ios.nonleaf_delete_countASnonleaf_changes,
        ios.nonleaf_allocation_countASnonleaf_page_splits,
        (ios.range_scan_count+ios.leaf_insert_count
            +ios.leaf_delete_count+ios.leaf_update_count
            +ios.leaf_page_merge_count+ios.singleton_lookup_count
           )total_changes
FROM    sys.dm_db_index_operational_stats(DB_ID(),NULL,NULL,NULL)ios
        JOINsys.objectssoONso.object_id=ios.object_id
        JOINsys.indexessiONsi.object_id=ios.object_id
                               ANDsi.index_id=ios.index_id
        JOINsys.schemasssONso.schema_id=ss.schema_id
WHERE   OBJECTPROPERTY(ios.object_id,'IsUserTable')= 1
ORDERBYleaf_changesDESC

--To check index fragmentation:
SELECT  a.index_id,
        b.nameAS[object_name],
        CONVERT(NUMERIC(5,2),a.avg_fragmentation_in_percent)pct_avg_fragmentation
FROM    sys.dm_db_index_physical_stats(DB_ID(),NULL,NULL,NULL,NULL)ASa
        JOINsys.indexesASbONa.object_id=b.object_id
                                 ANDa.index_id=b.index_id;


Script to test:
CREATEDATABASETestDB
GO
USE[TestDB]
GO

CREATETABLE[tblLarge](
       [xID][int]IDENTITY(1,1)NOTNULL,
       [sName1][varchar](10)DEFAULT'ABC'NOTNULL,
       [sName2][varchar](13)DEFAULT'ABC'NOTNULL,
       [sName3][varchar](36)DEFAULT'ABC'NOTNULL,
       [sIdentifier][char](2)NULL,
       [dDOB][date]NULL,
       [nWage][numeric](12, 2)NULL,
       [sLicense][char](7)NULL,
       [bGender][bit]NULL
)ON[PRIMARY]
GO


-- Clustered key on xID
ALTERTABLEtblLargeADDCONSTRAINTPK_tblLarge
PRIMARYKEYCLUSTERED (xID)WITH (FILLFACTOR=90)
GO

-- DROP constraint
ALTERTABLE[dbo].[tblLarge]DROPCONSTRAINT[PK_tblLarge]
GO

-- Multi-column clustered key
ALTERTABLEtblLargeADDCONSTRAINTPK_tblLarge
PRIMARYKEYCLUSTERED (sName1,sName2,sName3)WITH (FILLFACTOR=90)
GO

-- Insert 100,000 records
            INSERT  INTOtblLarge
                    (sName1,
                      sName2,
                      sName3,
                      sIdentifier,
                      dDOB,
                      nWage,
                      sLicense,
                      bGender
                    )
            VALUES  (LEFT(CAST(NEWID()ASVARCHAR(36)), 8),
                      LEFT(CAST(NEWID()ASVARCHAR(36)), 13),
                      CAST(NEWID()ASVARCHAR(36)),
                      LEFT(CAST(NEWID()ASVARCHAR(36)), 2),
                      DATEADD(dd,-RAND()* 20000,GETDATE()),
                      (RAND()* 1000 ),
                      SUBSTRING(CAST(NEWID()ASVARCHAR(36)), 6, 7),
                      COALESCE(ISNUMERIC(LEFT(CAST(NEWID()ASVARCHAR(36)),1)),0))
GO 100000


Fragmentation Comparison:
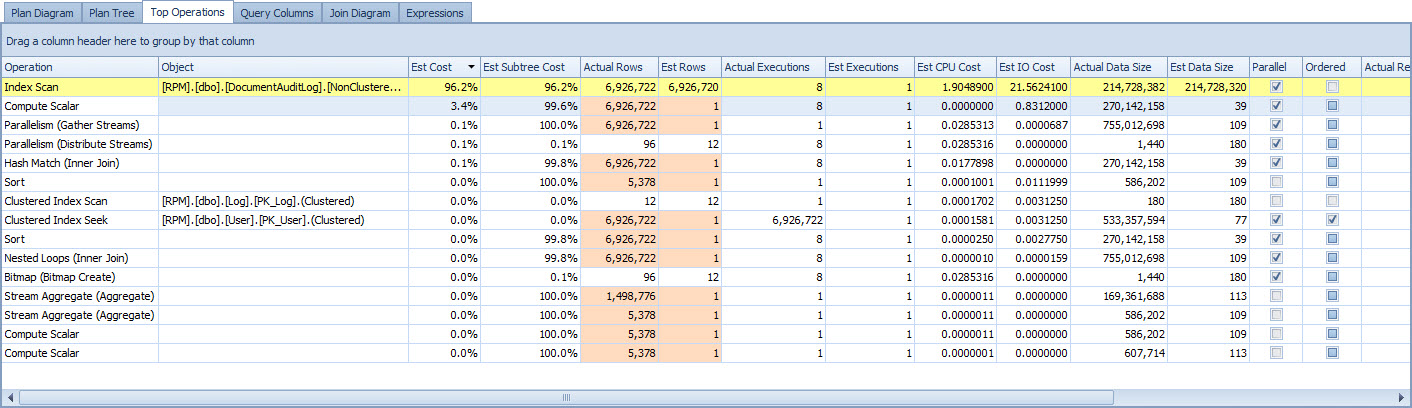
As you can see from the following picture given below that the fragmentation and page split has been increased dramatically when wide key has been used.

Figure#1: Narrow clustered key


Figure#2: Multi-column clustered key


Conclusion:
While using wide key or multi-columns for clustered index is supported by SQL Server, but we should not overlook the dangerous performance consequences that occurs silently. 


Reference:
Clustered Index Design Guidelines

NUMA - Memory and MAXDOP settings

$
0
0
It is common practice to put more hardware power to alleviate the application performance issues rather than fixing the issues. For short life and non-mission critical applications, it makes sense. But for the mission critical applications that benefit from upgraded hardware, it does not last long. Fixing application issues become more obvious and important. At the same time, tweaking the server configuration is also necessary to operate the Database server flawlessly.

Modern hardware, such as NUMA based server technology, has a tremendous capability to process application requests faster than SMP architecture. Microsoft SQL Server is fully capable of using the NUMA architecture and taking advantage of it. Starting from SQL 2000 SP4, Microsoft supports Hardware NUMA and in each release, support for the NUMA architecture is getting enhanced.

NUMA and Memory Setting:
In a NUMA based system, memory setting (min server memory and max server memory) plays an important role. It is generally the best practice to configure memory in such a way that allocated memory is distributed evenly across all NUMA nodes. This will help each NUMA node to operate independently without demanding memory from other nodes. Accessing memory on another NUMA node is called “remote memory access” and accessing memory on the same NUMA node is called “local memory access”. Accessing different node for memory introduces latency.

To get best out of the NUMA system, the following settings are highly recommended:

1.      Lock Pages in Memory: The SQL Server Service account needs to have “Lock Pages in Memory” in place in the Windows local security policy. This will prevent paging out SQL Server memory back to Windows.

2.      Max and Min Server Memory: Max and Min server memory will need to be equal for two reasons:

(a)   This will reduce overhead (allocation and de-allocation) that would otherwise be used by SQL Server dynamically managing these values.
(b)   As Memory calculation is usually derived from “Max Server Memory”, SQL Server Engine will have better values to allocate physical memory evenly to each NUMA node. This will reduce “Foreign Memory” requirement that occurs during data processing on one node.

3.      MAXDOP: For servers that have NUMA configured, MAXDOP should not exceed the number of CPUs that are assigned to each NUMA node. Meaning that if a server has 4 NUMA nodes then MAXDOP will be 4 or less. This will reduce threading overhead that occurs which will then be utilizing more NUMA nodes simultaneously.

Memory Allocation in each NUMA node:
To learn how much memory each node has received, PerfMon or sys.dm_os_perfromance_counterscan be used. Following is a buffer allocation from an 8 node NUMA system.

DMV Query:
select  counter_name,
        cntr_value* 8 / 1024 node_memory_mb,
        instance_name
from    sys.dm_os_performance_counters
where   [object_name]like'%Buffer Node%'
        andcounter_namelike'Total Pages%'
orderbyinstance_name
computesum(cntr_value* 8 / 1024 )


select  counter_name,
        cntr_value* 8 / 1024  total_buffer_mb,
        instance_name
from    sys.dm_os_performance_counters
where   [object_name]like'%Buffer Manager%'
        andcounter_namelike'Total Pages%'
orderbyinstance_name


CPU Usages in each NUMA Node:


Some disadvantages:
Although NUMA architecture is increasing processing power, there are some usage patterns which introduce some Latch contention in 32+ cores. In that case, database schema design such as index needs to be reviewed. A detailed guideline can be found in Microsoft’s technical document paper: “Diagnosing and Resolving Latch Contention on SQL Server”.

If overtime “Foreign Pages” counter is high for one or more nodes, this usually means that the nodes require more memory to perform a particular workload. While adding more memory might help, it is recommended to see if the query can be optimized along with index changes.

Read More:
SQL Server and Large Pages Explained

Recommendations and guidelines for the "max degree of parallelism" configuration option in SQL Server

SQL Server, Buffer Node Object

Diagnosing and Resolving Latch Contention on SQL Server

How It Works: SQL Server (NUMA Local, Foreign and Away Memory Blocks)

SQL Server, CPU and Power Policy – save the civilization

$
0
0
From the dawn of time, power has been linked with human history; in the past, present and future. The advancement of our species, the Homo sapiens, has been one of the most successful organisms on Earth to this day. The lighting of fire had fueled the creation for a modern world and that is what separated our evolutionary abled bodies from the ape species which existed before.

We produce power and consume it every nanosecond to continue through our daily lives. We also have concerns about using unnecessary power and we encourage others to reduce power so that we can save our planet and preserve it for our future generation. This makes sense.

We need to think carefully about how to use power and consume it effectively in SQL Server OLTP implantation.

OLTP and Windows Power Policy:
In cases, especially in OLTP and CPU-intensive application where concurrency is high, we want to make sure that the database server receives enough power to process each instruction without any latency. Saving some power in such cases is not an option as the power consumption directly affects CPU, which brings CPU latency and increases application response time.

Windows Power Policy:
In Windows 2008, there are three power consumption options (power plan), where “Balanced” is set to default and many SysAdmin or DBA never think to change to high performance mode. As a result, performance hurts and the overall performance degrades dramatically which can’t be understood the usual way. As per different leading experts research, “High Performance” mode will provide 10% to 30% overall performance improvement.

However, just enabling “High Performance” mode does not guarantee that Windows will be able to consume power uninterruptedly. To make this Windows configuration effective, we also need to configure server BIOS power management to “OS Control” mode. Without this configuration, Windows or ESX will not operate as desired.

Virtualization:
The populate virtualization application VMWare also recommends using “OS Control“ in hardware BIOS level and configure “High performance” mode in ESXi power Management. This configuration is also recommended in Microsoft Hyper-V implementation.

Power and CPU correlation Testing:
There is a tool which is known as “Geekbench” which can be used to test how power consumption affects the CPU Performance. You can find this tool at http://www.primatelabs.com/geekbench/. Geekbench is widely used by many industry experts as a CPU stress testing tool.

Figure: HP power management
Figure: Windows 2008 power management

 Figure: ESXi power management


References:
Degraded overall performance on Windows Server 2008 R2
http://support.microsoft.com/kb/2207548

Configuring Windows Server 2008 Power Parameters for Increased Power Efficiency
http://blogs.technet.com/b/winserverperformance/archive/2008/12/04/configuring-windows-server-2008-power-parameters-for-increased-power-efficiency.aspx

Host Power Management in VMware vSphere 5.5
http://www.vmware.com/resources/techresources/10205
 

“xp_delete_file”: A simple PowerShell Script alternative

$
0
0
There are numerous threads that can be found on “xp_delete_file” regarding various issues when used in a Maintenance Plan in SQL Server to remove old database backup (bak) or transaction backup (trn) from the OS folder. This is a built-in and undocumented extended stored procedure and used internally by the Maintenance Plan Wizard. This Extended Stored Procedure can also be executing manually in SSMS such as:

declare@filedatedatetime
set@filedate=getdate()- 5
executemaster.dbo.xp_delete_file0,'d:\temp\','bak',@filedate, 1

Issues:
We often find that the maintenance task fails with the following error message in ERROR Log and SQL Agent Job history respectively. In addition to the message, we will also see mini-dump in the SQL Server log folder.

Error: 18002, Severity: 20, State: 1.
Exception happened when running extended stored procedure 'xp_delete_file' in the library 'xpstar.dll'. SQL Server is terminating process 73. Exception type: Win32 exception; Exception code: 0xc0000005.

Source: Maintenance Cleanup Task Execute SQL Task Description: Executing the query "EXECUTE master.dbo.xp_delete_file 0, N'd:\temp', N'trn', N'2010-01-21T13:00:00'" failed with the following error: "A severe error occurred on the current command. The results, if any, should be discarded. A severe error occurred on the current command. The results, if any, should ... The package execution fa... The step failed.

If we run “xp_delete_file” manually in SSMS, we may see the following error message:

Msg 0, Level 11, State 0, Line 0
A severe error occurred on the current command.  The results, if any, should be discarded.
Msg 0, Level 20, State 0, Line 0
A severe error occurred on the current command.  The results, if any, should be discarded.

Alternative to “xp_delete_file”:
As this functionality has some known issues and consequences, it is wise to use PowerShell script as an alternative.  Following are a few examples on how to remove older “bak” or “trn” files from a folder as well as from sub-folder. This PowerShell Script can be used to delete any kind of files from OS.

Example One (based on number of days):
Remove database backup files with the extension “bak” which are longer than 5 days old.

# target path
$TargetPath="d:\temp\"

# files to delete more than 5 days
$Days= 5

# extension of the file to delete
$Extension="*.bak"
$CurrentDate=Get-Date
$LastWrite=$CurrentDate.AddDays(-$days)

# Get files based on lastwrite filter in the specified folder
$FilesToDelete=Get-Childitem$targetpath-Include$Extension-Recurse|Where{$_.LastWriteTime-le"$LastWrite"}

foreach($FilesToDeletein$FilesToDelete)
    {
    if ($FilesToDelete-ne$NULL)
        {   
        Remove-Item$FilesToDelete.FullName|out-null
        }
    }


Example Two (based on number of hours):
Remove transaction log backup files with the extension “trn” which are longer than 10 hours old.

# target path
$TargetPath="d:\temp\"

# files to delete more than 10 hours
$Hours= 10

# extension of the file to delete
$Extension="*.trn"
$CurrentDate=Get-Date
$LastWrite=$CurrentDate.AddHours(-$Hours)

# Get files based on lastwrite filter in the specified folder
$FilesToDelete=Get-Childitem$targetpath-Include$Extension-Recurse|Where{$_.LastWriteTime-le"$LastWrite"}

foreach($FilesToDeletein$FilesToDelete)
    {
    if ($FilesToDelete-ne$NULL)
        {   
        Remove-Item$FilesToDelete.FullName|out-null
        }
    }


Using PowerShell script in SQL Agent Job (SQL 2008+):
Using PowerShell Script in SQL Server Agent Job is simple. Follow the steps described below:

1.      Create a new SQL Agent Job, for example “Remove_older_BAK_files”.
2.      “In the Job Step properties” – select “PowerShell” as a type (figure #1).
3.      Paste the PowerShell script. Don’t forget to adjust your path and day parameter according to your need.
4.      Exit by saving the job and then execute it.

If you want to use the above job in a Maintenance Plan, you can use “SQL Server Agent Job Task” as shown below (figure #2).

Figure #1: SQL Agent Job with PowerShell Script:

 
Figure #2: Maintenance Plan with PowerShell Scripted Job:


DATEDIFF function– A common performance problem

$
0
0
DATEDIFF is one of the most widely used built-in functions to calculate the difference between two date points. Microsoft says DATEDIFF can be used in the select list, WHERE, HAVING, GROUP BY and ORDER BY clauses. Programmatically and logically this statement is absolutely correct, however there is a catch when it is used on the WHERE clause. We often introduce “non-sargable” predicate with the DATEDIFF function which leads to poor performance. I don’t think that there are good guidelines for many new developers.

Usage patterns:
As a rule of thumb, we know that using function on the left side of the WHERE clause causes Table or Index scan. So when the DATEDIFF function or any other functions are used on a key column, we will obviously see performance issues. Some common patterns of DATEDIFF functions are as follows:

WHEREDATEDIFF(day,dJoinDate,@CurrentDate)>=30
WHEREDATEDIFF(d,dDateofBirth,@dDate)=0
WHEREa.LastNameLIKE  'Jon*'ANDDATEDIFF(d,a.dSalesDate,@dDate)=0
WHEREDATEDIFF(mm,dDate,GetDate())>= 15
WHEREYEAR(a.dDate)=2012

Issues observed:
Following are some definite issues which can be observed:
1.      Increased query response times.
2.      Table/Index scan in execution plans.
3.      Short or long durations of SQL blockings.
4.      Increasing of locking overhead.
5.      Unnecessary I/O activities and memory pressure.
6.      Parallel query plan and “sort operation”.

Sample Scripts to understanding the performance issues:
Let’s create a database and table; and then populate the table with data to explore some of the performance issues which may arise from a non-sargable predicates.

/******************************************************
Create database and some relevant stuff
******************************************************/
setnocounton
createdatabaseTestDB
go

useTestDB
go

ifobject_id('tblLarge')isnotnull
    droptabletblLarge
go

createtabletblLarge
    (
      xIDintidentity(1, 1),
      sName1varchar(100),
      sName2varchar(1000),
      sName3varchar(400),
      sIdentifierchar(100),
      dDOBdatetimenull,
      nWagenumeric(20, 2),
      sLicensevarchar(25)
    )
go


/******************************************************
Add some records with non-blank dDOB
******************************************************/
setnocounton
insert  intotblLarge
        (sName1,
          sName2,
          sName3,
          sIdentifier,
          dDOB,
          nWage,
          sLicense
        )
values  (left(cast(newid()asvarchar(36)),rand()* 50),    -- sName1
          left(cast(newid()asvarchar(36)),rand()* 60),    -- sName2
          left(cast(newid()asvarchar(36)),rand()* 70),    -- sName2
          left(cast(newid()asvarchar(36)), 2),              -- sIdentifier    
          dateadd(dd,-rand()* 20000,getdate()),            -- dDOB
          (rand()* 1000 ),                                  -- nWage
          substring(cast(newid()asvarchar(36)), 6, 7)        -- sLicense       
        )
go 100000


/******************************************************
Create indexes
******************************************************/
altertabledbo.tblLargeaddconstraint
PK_tblLargeprimarykeyclustered
(
xID
)with(pad_index=off,
          fillfactor= 85,
          allow_row_locks=on,
          allow_page_locks=on)
go

createnonclusteredindex[IX_tblLarge_dDOB_sName1]on[dbo].[tblLarge]
(      [dDOB]asc,
[sName1]asc
)with (pad_index=off,
          allow_row_locks=on,
          allow_page_locks=on,
          fillfactor= 85)
go


Example #1: DATEDIFF: non-sargable predicate:
Let’s consider the following commonly used patterns of the DATEDIFF function:

declare@dDateasdatetime
set@dDate='2012-09-19'

-- #0: non-sargable search
select  xID,
        sName1,
        dDOB
from    tblLarge
where   datediff(d,dDOB,@dDate)= 0
orderbydDOB


The above query results with Index Scan and below is the execution plan:


Optimizing the search:
The above query can be optimized a couple different ways and will result in an efficient execution plan:

-- #1: sargable predicate
select  xID,
        sName1,
        dDOB
from    tblLarge
where   dDOBbetween'20120919'and'20120920'
orderbydDOB

-- #2: sargable predicate
select  xID,
        sName1,
        dDOB
from    tblLarge
where   dDOBbetweencast(convert(varchar(12),@dDate, 112)+' 00:00:00'asdatetime)
             and     cast(convert(varchar(12),@dDate+ 1, 112)+' 00:00:00'asdatetime)
orderbydDOB

-- #3: sargable predicate
select  xID,
        sName1,
        dDOB
from    tblLarge
where   dDOBbetweenconvert(char(8),@dDate, 112)
             and     convert(char(8),@dDate+ 1, 112)
orderbydDOB


Following are the execution plans and cost comparisons:

Example #2: DATEDIFF: non-sargable predicate:
Consider the following as a non-sargable example.

declare@dDateasdatetime
set@dDate='2013-11-19'

select  xID,
        sName1,
        dDOB
from    tblLarge
where   datediff(dd,dDOB,@dDate)<= 1
orderbydDOB


To optimize the above query we can move the DATEDIFF function from left side to the right side.

declare@dDateasdatetime
set@dDate='2013-11-19'

select  xID,
        sName1,
        dDOB
from    tblLarge
where   dDOB>=dateadd(dd,-1,@dDate)
orderbydDOB

Following is the optimization effort which results in better query response time.


Example #3: YEAR- non-sargable predicate:
This is an example of YEAR function used on datetime column which results with index scan and can be re-written in a slightly different way.

-- non-sargable
select  xID,
        sName1,
        dDOB
from    tblLarge
where   year(dDOB)= 2010
orderbydDOB

-- sargable
select  xID,
        sName1,
        dDOB
from    tblLarge
where   dDOB>='01-01-2010'
        anddDOB<'01-01-2011'
orderbydDOB

Execution plan and cost comparison:


Summary:
Writing efficient query for OLTP application needs more careful consideration and understanding of various techniques. Just satisfying the business requirement is not enough; we also need to make sure each query is a super performer by removing non-sargable predicates. 

A PowerShell Script to monitor enterprise wide disk space usage

$
0
0
The folks who are responsible for administering thousands of Windows Servers all know that monitoring disk space is crucial for application performance. When there are numerous Windows Servers, such as thousands, it becomes more difficult to know what is going on where; and thus putting an effective monitoring tool in place is absolutely necessary for proactive monitoring purposes.

I recently faced a challenge to collect disk space usage about more than 300 (SQL Servers) out of 2000 Windows Servers across the enterprise and send the collected information by e-mail. To complete the task, the output should be easy to understand and the server should contain a brief description so that we can quickly identify the purpose of the server. Following is a desirable output format.

Figure#1: Sample disk usage html report:

To achieve this goal, I have developed a custom PowerShell Script and scheduled it to run every 6 hours. It investigates all Windows Servers listed in a CSV file through Job. To schedule this script, I have used SQL Server Agent since I felt more comfortable with it and because it is easy to implement. However, Windows Schedule Task can also be used to do the same functions.

PowerShell Script:
Download the original Script:  http://bit.ly/1lybRQy

#set-executionpolicy unrestricted

#+++++++++++++++++++++++++++++++++++++++++++++++++++++++++++++++++++++
# Send email to all DBA
#+++++++++++++++++++++++++++++++++++++++++++++++++++++++++++++++++++++

functionSend-EmailToDBA {
 param(
        [Parameter(Mandatory=$true)][string]$emailBody,
        [Parameter(Mandatory=$true)][string]$emailSubject
    )

    $EmailFrom="noreply@myCompanyorg"
    # $EmailTo = "abcxyz@myCompanyorg, abc@myCompanyorg, xyz@myCompanyorg"

    $SMTPServer="smtpServer.org"

    $mailer=new-objectNet.Mail.SMTPclient($smtpserver)
    $msg=new-objectNet.Mail.MailMessage($EmailFrom,$EmailTo,$EmailSubject,$Emailbody)
    $msg.IsBodyHTML =$true
    $mailer.send($msg)
} # end of function


#+++++++++++++++++++++++++++++++++++++++++++++++++++++++++++++++++++++
# Get-DiskInfo
#+++++++++++++++++++++++++++++++++++++++++++++++++++++++++++++++++++++

functionGet-DiskInfo {
    [CmdletBinding()]
    param(
        [Parameter(Mandatory=$True,ValueFromPipeline=$True)]
        [string[]]$FileFullPath='i:\ServerList\servers.txt',
        
        [Parameter(Mandatory=$True,ValueFromPipeline=$True)]
        [decimal]$DiskThreshold= 10
    )
    
    BEGIN {}
    PROCESS {
        $SHBServers= (import-csv$FileFullPath-Header Server, Description)
        foreach ($computerin$SHBServers) {           

            $Server= $($Computer.Server).split("\")[0]
            # $disks =Get-WMIObject -ComputerName $computer.server Win32_LogicalDisk | Where-Object {$_.DriveType -eq 3}
            $disks =Get-WMIObject-ComputerName$ServerWin32_LogicalDisk | Where-Object {$_.DriveType -eq 3}
           
            foreach ($diskin$disks ) {

               if ($disks.count -ge 0) {           
                   $Used=$disk.freespace /$disk.size * 100
                   $result=  @{'Server'=$computer.server;
                              'Server Description'=$computer.description;
                              'Volume'=$disk.VolumeName;
                              'Drive'=$disk.name;
                              'Size (gb)'="{0:n2}"-f ($disk.size / 1gb);
                              'Used (gb)'="{0:n2}"-f (($disk.size -$disk.freespace) / 1gb);
                              'Free (gb)'="{0:n2}"-f ($disk.freespace / 1gb);
                              '% free'="{0:n2}"-f ($disk.freespace /$disk.size * 100)}                         
                             
                   $obj=New-Object-TypeNamePSObject-Property$result
                   if ($Used-lt$Diskthreshold){  
                        Write-Output$obj }
               }
            }
        }
    }
    END {}
} # end of function

#+++++++++++++++++++++++++++++++++++++++++++++++++++++++++++++++++++++
# Script to generate disk usage report
#+++++++++++++++++++++++++++++++++++++++++++++++++++++++++++++++++++++
$Today= [string]::Format( "{0:dd-MM-yyyy}", [datetime]::Now.Date )
$ReportFileName="i:\Sarjen\Report\DiskUsage_$Today.html"

# Custom HTML Report Formatting
$head=@"
        <style>
            BODY{font-family: Arial; font-size: 8pt;}
            H1{font-size: 16px;}
            H2{font-size: 14px;}
            H3{font-size: 12px;}
            TABLE {border-width: 1px;border-style: solid;border-color: black;border-collapse: collapse; background-color:#D5EDFA}
            TH {border-width: 1px;padding: 3px;border-style: solid;border-color: black;background-color: #94D4F7;}
            TD {border-width: 1px;padding: 3px;border-style: solid;border-color: black;}        
        </style>
"@

    #define an array for html fragments
    $fragments=@()

    # Set free disk space threshold below in percent (default at 10%)
    [decimal]$thresholdspace= 20

    #this is the graph character
    [string]$g=[char]9608 

    # call the main function
    $Disks=Get-DiskInfo`
                -ErrorAction SilentlyContinue `
                -FileFullPath ("i:\Sarjen\SQLServers.txt") `
                -DiskThreshold $thresholdspace
           
    #create an html fragment
    $html=$Disks|select @{name="Server";expression={$_.Server}},
                  @{name="Server Description";expression={$_."Server Description"}},
                  @{name="Drive";expression={$_.Drive}},
                  @{name="Volume";expression={$_.Volume}},
                  @{name="Size (gb)" ;expression={($_."size (gb)")}},
                  @{name="Used (gb)";expression={$_."used (gb)"}},
                  @{name="Free (gb)";expression ={$_."free (gb)"}},
                  @{name="% free";expression ={$_."% free"}},           
                  @{name="Disk usage";expression={
                        $UsedPer= (($_."Size (gb)"-$_."Free (gb)")/$_."Size (gb)")*100
                        $UsedGraph=$g* ($UsedPer/4)
                        $FreeGraph=$g* ((100-$UsedPer)/4)
                        #using place holders for the < and > characters
                         "xopenFont color=Redxclose{0}xopen/FontxclosexopenFont Color=Greenxclose{1}xopen/fontxclose"-f$usedGraph,$FreeGraph }}`
        | sort-Object {[decimal]$_."% free"} `
        | ConvertTo-HTML-fragment
    
    #replace the tag place holders. It is a hack but it works.
    $html=$html-replace"xopen","<"
    $html=$html-replace"xclose",">"
    
    #add to fragments
    $Fragments+=$html         

    #write the result to a file
    ConvertTo-Html-head$head-body$fragments`
     | Out-File$ReportFileName
    
      # Open the html file
      # ii $ReportFileName

    $Emailbody= (Get-Content$ReportFileName ) | out-string
    $EmailSubject="Disk usage report - Drives less than $thresholdspace% free space"

    Send-EmailToDBA -EmailBody $Emailbody -EmailSubject $EmailSubject                          


Figure#2: CSV file for Server list with description: 

Figure#3: SQL Agent Job to run the PowerShell Script:

Pre-requisites:
To collect disk information from multiple servers, we need the following rights or privileges:

1.      WMI access to the target server.
2.      Privileges to run PowerShell Script in the source server. Run the following command:

set-executionpolicy unrestricted

3.      Have PowerShell version 2.0 or above.

Script Explanation:
1.      The PowerShell script reads the Server name (figure#2) from a CSV file. This CSV file contains the Server name and description.
2.      The Script will check the percentage of free disk space, for example 10% or 20%, etc.
3.      The output will be preserved in HTML format.
4.      An e-mail notification will be sent and the email body will contain the HTML table.

Running the Script:
The script can be run manually or through a Windows or SQL Agent Job. Figure#3 is an example of how to run it by utilizing SQL Agent Job.

Conclusion:
I am running this script against 200+ productions Windows Server and it took around 2 minutes to complete. Although this script does its job, there is room for improvement, such as adding error handling and logging. So if you enhance this script and improve its functionality, then I request that you share your modified script with me.

Database optimization - the missing step

$
0
0
Does your intelligence or your magical database optimization scripts really optimize the database? The traditional wisdom is to optimize indexes and statistics, but how about optimizing a HEAP (a table without clustered index) by removing fragmentation in your database?

Database optimization, more precisely Index optimization is one of the major tasks every DBA performs on a regular basis regardless the size of the database. Based on daily data changes and fragmentation threshold, DBA decides to optimize indexes such as REBUILD, RE-ORGANIZE.

Free automated script:
A lot of automated index optimization scripts are freely available to help improve your database performance. But if you carefully review these index optimization statements, you will discover that those scripts cautiously avoid optimizing HEAP. If so, then your database is not fully optimized.

Generally, if a HEAP table is part of the OLTP system, then it is highly recommended that it should be clustered. However, there are business logic, reasons and mistakes as well to not create clustered Index on a table and keep the table as a HEAP. As a result, executing queries against these tables become very resource intensive.

Starting form SQL 2008, a HEAP can be optimized as well with the “ALTER TABLE <xxxxx> REBUILD” option. Therefore, to optimize a HEAP we no longer need to create a clustered index and dropping it afterward.

Key points to remember:
1.      If the HEAP contains non-clustered indexes, all indexes will be rebuilt (dropped and recreated).
2.      Fill Factor can’t be set on a HEAP.
3.      All or a specific partition can be optimized.
4.      Data compression (PAGE or ROW level) can be set or changed.

Script to check HEAP fragmentation:
select  o.name,
        ips.index_type_desc,
        ips.avg_fragmentation_in_percent,
        ips.record_count,
        ips.page_count,
        ips.compressed_page_count
from    sys.dm_db_index_physical_stats(db_id(),null,null,null,'DETAILED')ips
        joinsys.objectsoono.object_id=ips.object_id
where   ips.index_id= 0
        andips.avg_fragmentation_in_percent> 0
orderbyips.avg_fragmentation_in_percentdesc;

T-SQL Statement example to optimize HEAP:
ALTERTABLEtblLargeREBUILD
ALTERTABLEtblLargeREBUILDwith (MAXDOP= 4)
ALTERTABLEtblLargeREBUILDWITH (DATA_COMPRESSION=PAGE)
ALTERTABLEtblLargeREBUILDPARTITION= 1 WITH (DATA_COMPRESSION=NONE)
ALTERTABLEtblLargeREBUILDPARTITION=ALLWITH (DATA_COMPRESSION=PAGEONPARTITIONS(1))

Comments:
You should not rely on only index optimization; make sure that you are taking care of HEAP as well. In my experience, I have seen many DBAs - even SQL experts – overlooking this area.

Learn More:
A SQL Server DBA myth a day: (29/30) fixing heap fragmentation

ALTER TABLE (Transact-SQL)

FREE: Real-time SQL Server Performance Monitor - Extreme visibility to SQL Server database engine

$
0
0
Background of the tool:
“SQL Performance Monitor”. It is completely Free, Agent less,  No Installation/Configuration is required, Single executable and portable, easy to use and only needs a couple of clicks to be up and running. As database administrators, we have to support different SQL Server environments. Often it becomes a challenge and obvious to understand the current server health status. To attain this goal based on my requirements, I have created a small tool "SQL Monitor".


Download Link:
SQL Performance Monitor - v2.5
Last Update :   09 April 2014
        ** Automated Long running queries
        ** Automated SQL Blocking check

Download Link: http://bit.ly/1gvWgiw

Agreement:
This is a non-commercial, educational and learning purpose tool. It is not an alternative for any commercial grade application. This tool is efficient and sharp like a blade; however, I will not able to provide any warranty, guarantee or accuracy of this tool. Although it is a lightweight data collection and visualization tool, it should not cause any performance issues, however you should test it yourself before running it against any database server.

Figure: SQL Performance Monitor


challenge:
Retrieving and visualizing the SQL Server performance data is always a challenge and a tedious task for SQL Server database professionals. Utilizing the Windows PerfMon application is the easiest way to perform this task as well as querying “sys.dm_os_performance_counters” and some other DMVs brings a lot of useful information.

Starting from SQL Server 2005, Microsoft has introduced DMV to query various internal metadata directly to explore various health status data. Although collecting and analyzing SQL Server performance data in a regular basis provides trending ability, monitoring real-time performance data is critical to understand an ongoing performance condition that is occurring.

We are all familiar with built-in “SQL Server Activity Monitor” and obviously it is a good starting point to troubleshoot some SQL Server issues. However, the capacity of this tool is limited as it does not provide other performance metrics which are important to understand the server health status. To extend this idea especially during a performance condition, I have attempted to develop a “SQL Performance Monitor” desktop app by including some other interesting metrics which I believe might be helpful to troubleshoot or understand a problem.

This tool collects more than 50+ performance data directly from SQL Server in real-time and shows data in the chart continuously. Also, it does not require any installation and configuration.

Data collection:
SQL Scripts used in my tool are excerpted from SSMS and some are collected from various forums which are freely available. My understanding is that all the scripts that I have used are reliable however if any are not working, please let me know and I will attempt to fix the issue.

How does it work?
1.           Has the ability to monitor only a single SQL instance at a time and can be used against all editions of SQL Server from 2005 to SQL 2014
2.           Charts and grids will be populated with collected performance data every 5 seconds by default (can be changed) for every 5 minutes (can be changed) moving forward.
3.           Performance data will be saved automatically as they are collected in a SQLite database (sqlmonitor.db3).
4.           All saved performance data can be queried, and then can be exported as a CSV format. As “sqlmonitor.db3” is not protected therefore it can be opened with any SQLite tool.

Limitations:
1.           It has no notification system, such as email, alert, popup.
2.           It is a desktop 32-bit application, cannot run as a service.
3.           Chart colors have no special meaning.

Known Limitations:
(a)       SQL 2005 – in the “Server Info” tab the “Available Memory” will be zero.
(b)       CPU utilization has been calculated from “Resource Pool” and @@CPU_BUSY. Due to the internal limitation of SQL Server, and feature limitation of Standard and Express editions, CPU value may show zero on the chart. In Enterprise edition, CPU utilization will not be zero.

How to run:
(a)   Create a folder.
(b)   Download the “SQLMonitor.exe” in that folder.
(c)    Run the executable “SQLMonitor.exe”– that’s it.
(d)   There is no extra configuration or components required to run this tool.

Connect to a database server:
The tool bar of “SQL Performance Monitor”

Figure#1: Tool bar of SQL Activity Monitor

First time connection:
To connect a SQL Server instance, click the “SQL Server to Monitor” button. Supply the required information and then click “Try Connect” in the connection dialog box. Once connected, close the connection dialog box or choose another server to connect to.

All charts will be populated for an hour with blank data once a connection is made. It continues to collect and display data based on the duration configured on the tool bar. All collected data will be saved in a SQLite database (sqlmonitor.db) for later review and analysis.

Using a saved connection:
A successful connection can be saved for later use. Once the tool successfully connects to a database server, click the “save connection” button to save the connection string. An encoded text file will be created in the same folder with the “.txt” extension where the “SQLMonitor.exe” resides.

From the bottom list box of the “SQL Server Connection” (figure#2) dialog box, double click a previously saved file to connect to a SQL Server instance.

Couple of Screenshots from “SQL Performance Monitor”

Figure#2: SQL Server Connection dialog

Figure#3A: Viewing all running sessions

Figure#3B: Viewing all sessions

Historical data:
In the history tab, put “SQL Instance Name” and “date” to query historical data. Click any column header to view data in the chart. All data and charts can be saved.

Figure#4: Historical data browse


Figure#5: Summarizing historical data


Summary:
I use this tool on a regular basis and I hope someone may find it useful too. I will continue to add more features, so if you like it - check back often for updates.

Memory allocation for SQL Server - points to consider

$
0
0
Memory Allocation:
When we are talking about memory allocation for SQL Server, we usually mean memory allocation for the buffer pool. The two well-known parameters - the “max server memory” and the “min server memory” - always refer to the data buffer only.

These options do not include the memory that is allocated for other components within the SQL Server process. These components include the following:
(a)    The SQL Server worker threads.
(b)   The Multipage Allocator of SQL Server Memory Manager.
(c)    Various DLLs and components that the SQL Server process loads within the address space of the SQL Server process.
(d)   The backup and restore operations.
(e)   SQL Server Agent process.

Windows 2003 vs. Windows 2008/2008R2/2012:
In Windows 2003, OS manages its memory aggressively and always tries to free up physical memory; this generally introduces “paging out” issues in SQL Server. Windows 2008 and later versions are more educated and can manage memory dynamically and non-intrusively. Therefore a SQL Server running on a Windows 2008 or later edition has better experience and needs extra consideration for configuring SQL Server memory.

Windows 32-bit vs. 64-bit:
Windows 32-bit edition can’t use more than 4GB of physical memory while 64-bit Windows has varying limitations based on the edition.
(a)    In a 32-bit Windows Server, the /PAE switch is required to access more than 4GB of physical memory if installed. Enabling AWE in SQL Server is also required.
(b)   In a 64-bit environment, /PAE and /AWE are not required to be configured.

PAE and AWE Switch (physical memory <= 4GB):
If a 32-bit environment has less than or equal to 4GB of memory, the /3GB switch can be used to allocate more memory to the SQL Server. Once a /3GB switch is used, the total virtual memory will be splitting since1GB is for kernel mode and 3GB is for user mode usages.

PAE and AWE Switch (physical memory > 4GB):
In a 32-bit Windows Server and SQL Server implementation, if more than 4GB of memory is installed then both the PAE in Windows and AWE in SQL Server need to be turned on. In a 32-bit physical environment, the following configurations must be configured should the physical memory be used beyond 4GB.

(a)    LPIM – Assign this local right to the SQL Server service account.
(b)   Max Server Memory – use a fixed amount of memory for SQL Server.
(c)    /PAE – Enable switch in Windows if it is not done yet.
(d)   /AWE – Enable this switch in SQL Server.

If this is a Virtual implementation, then the provisioned Guest Memory must be reserved in VMWare ESXi or in MS Hyper-V to prevent memory swapping (balloon driver effect).

Memory configuration in 32-bit environment:
Follow the guidelines below when configuring memory for 32-bit SQL Server in a 32-bit environment.

Physical RAM
AWE
Boot.ini
Maximum “Max Server Memory”
4 GB
0 (Disabled)
/3GB
Dynamic (default)
8 GB
1 (Enabled)
/3GB, /PAE
6.5 GB
16 GB
1 (Enabled)
/3GB, /PAE
14.5 GB
32 GB
1 (Enabled)
/PAE
29.5 GB

Max Server Memory Allocation Guideline:
Although Microsoft recommends using dynamic memory configuration in a 64-bit environment, this recommendation does not consider suboptimal SQL database design, and other executing applications and processes. So the “Max Server Memory” setting is strongly recommended to limit the buffer pool of SQL Server. Following is the guideline for configuring Max server memory in a 64-bit SQL Server. Always consider leaving some additional memory for Windows and other applications based on workload.

Physical Memory
Minimum Memory for Windows
Maximum “Max SQL Server Memory”
<16
2
Dynamic / best judgment
16
4
12
32
6
26
64
8
56
128
16
112
256
16
240
512
32
480
1GB
48
976

Max and Min Server memory:
Consider allocating an equal amount of memory to the “Min Server memory” and “Max Server Memory” option. This will eliminate internal page allocation and de-allocation overhead.

NUMA and Memory Configuration:
When SQL Server detects NUMA in a physical or virtual server, it calculates memory allocation from “Max Server Memory” and assigns an equal amount of memory to each NUMA node. In case of dynamic memory configuration, SQL Server Engine assumes an arbitrary value which may not be sufficient for the current workload or over estimation may introduce OS memory issues.

Please note that SQL Server 2000 SP4 and later editions support NUMA memory.

Lock Pages in Memory (LPIM) and SQL Server Editions:
By default, Enterprise and Developer 64-bit editions of SQL Server 2005 and later versions support Locked Pages.

(a)    The standard edition of SQL 2005, SQL 2008 and SQL 2008 R2 support Lock Pages in Memory if the startup trace flag 845 is set.
(b)   The standard edition of SQL 2012 and SQL 2014 supports Lock Pages in Memory natively and does not require a 845 startup trace flag.
(c)    All 32-bit versions support Lock Pages in Memory with /PAE and /AWE switch.

Lock Pages in Memory (LPIM):
In 64-bit Windows 2008 or later editions, LPIM is not required as Windows manages memory dynamically in a non-intrusive way. However, certain workloads may need a generous allocation of guaranteed fixed memory to operate smoothly. In this case, LPIM can be assigned explicitly to the SQL Server Service account.

Following is the guideline for LPIM:

(a)    When Windows sits on a physical Machine:
(1)    Make sure that the “Max Server Memory” has been assigned.
(2)    For standard editions of SQL Server, add startup trace flag 845.

(b)   When Windows sits on a virtual Machine:
(1)    Make sure that the “Max Server Memory” has been assigned.
(2)    For standard editions, add startup trace flag 845.
(3)    Make sure that the provisioned guest memory has reservation in VMWare or in Hyper-V.

The trace flag 845 has no effect on the SQL Server Enterprise edition.

Index Creation Memory:
The ‘index creation memory’ option is self-configuring and usually works without requiring adjustment. A larger value might be helpful to improve index creation performance but there is no specific recommended value. Please note that the run value for this parameter will not exceed the actual amount of memory that can be used for the operating system and hardware platform on which SQL Server is running. On 32-bit operating systems, the run value will be less than 3 GB.

The run value needs to be equal or greater than the “Min memory per query” when set.

Min memory per query:
The default value of 1024 KB works well for almost all cases. If some queries experience excessive sort and hash operation, and if optimizing the query and refactoring associated indexes out of scope then this value can be bumped up gradually to improve performance. If changing the setting helps then consider adding more physical memory and allocating more memory to the data buffer pool. The maximum limit is 2GB for this setting.

-g Switch (mostly applicable for SQL 2000 and 2005):
The –g switch reserves additional memory outside SQL Server’s buffer pool in the SQL Server process for extended stored procedures, executing distributed queries, loading DLLs of extended stored procedures and calling OLE automation objects from Transact-SQL. Consider using this switch if the following message is logged in the Error Log.

WARNING: Failed to reserve <n> bytes of contiguous memory
WARNING: Failed to reserve contiguous memory of Size= <allocation_size>

More reading:

SQL Server installation and initial configuration – points to consider

$
0
0

The journey starts with the SQL Server installation. Installing a SQL Server is key for a stabilized and healthy database system. A properly installed and configured SQL Server rarely shows any issues. So let’s get started.

Service Account recommendation:
Although a single DOMAIN\ACCOUNT can be used for the SQL Server and the SQL Agent service, it is not desirable and not recommended as both services have different execution context. Use separate domain accounts for each service.

Installation recommendation:
If a DOMAIN\ACCOUNT is used for the SQL Server service account, then
(a)   Add the DOMAIN\ACCOUNT to the local administrator group.
(b)   Log on to the intended server with this account.
(c)    Run the SQL Server setup executable as “run as administrator” privileges.
(d)   Installation media can be resided in a network share or in a DVD.

Once installation is done, you need to remove the SQL Server account from the local admin group; this is recommended for security reasons. However, please note that you may still prefer the SQL Server Service account to be a part of the local admin group to avoid permission related issues.

Local policy rights to SQL Server Service Account:
SQL Server service account rights varies from edition to edition. Do not assign any local policy rights to SQL Server and SQL Agent service account in advance which are not recommended. Each edition of the SQL Server installation process will determine the required local policy rights and will be added automatically during the installation of SQL Server. To validate appropriate service rights, review the MSDN recommendations from the following link:


Windows consideration:
(a)   Network Binding order:
1.      Make sure that the domain network is the first bound network. The miss-ordering issue usually reports in SQL Server fail-over cluster installation.
2.      Usually, TCP/IP will be the most used protocol. Consider changing the order of “network protocol bindings” to make network communications faster.

(b)   Disk alignment and block size:
1.      NTFS Allocation Unit (formerly known as cluster size) must be 64K. When formatting the partition that will be used for SQL Server data files, it is recommended that you use a 64-KB allocation unit size for data, logs, and tempdb.
2.      Ensure that Volume Alignment(also known as disk, partition or sector alignment) has been set correctly. Review and align the sector to 1024KB (or 2048KB max) before formatting the disk.
3.      HBA Disk Queue Depth: In the SAN, a queue depth of 64 is generally accepted as a good starting point in the absence of any specific vendor recommendations.

(c)    Windows Power Policy option: In Windows 2008, there are three power consumption options (power plan), where “Balanced” is set to default. Make sure that the “High Performance” has been selected. To make “power plan” configuration effective, the server BIOS power management needs to be changed to “OS Control” mode.
(d)   TCP Chimney setting: Disable the TCP Chimney offload in Windows level. “TCP Chimney Offloads” functionality does not work with virtualized Windows OS (VMware and hyper-v), therefore it can be disabled permanently.
(e)   SQL Server Port: Create an appropriate inbound rule in Windows firewall for SQL Server ports (e.g. 1433, 5022) instead of disabling the firewall service.

Instant file initialization: To take advantage of the instant file initialization feature, assign the “Perform volume maintenance tasks” windows right to the SQL Server Service Account. When it is enabled, the data file (mdf and ndf, but not ldf) will be initialized instantaneously without filling any empty spaces with zeros.

Tempdb consideration: It is not necessary to create multiple tempdb data files without understanding the workload nature and concurrency in a Server. If the OLTP server experiences high concurrencies, latch contention, row versioning, a high number of sort/hash operations, then adding multiple data files will be helpful.

(a)   In a SMP based system, 8 tempdb data files can be added initially. If more data files are required, then add two tempdb data files at a time.
(b)   In a NUMA based system, add data files based on the number of NUMA nodes detected by the SQL Server Engine. For a 4-NUMA system, the tempdb might have 8 or 12 data files. If more data files are needed, then increase the tempdb data files by the number of NUMA nodes.
(c)    Make sure that all tempdb data files are equal in size.
(d)   Tempdb data files and log must be isolated and resided in a single dedicated drive. Log files of tempdb can be placed in the Log drive, but it is not necessary.

MAXDOP: The default value of MAXDOP is 0 (zero). It works best for a well written OLTP application and if the database is maintained properly. However, in some workloads, MAXDOP = 1 works best, such as SharePoint database. There is no appropriate settings for MAXDOP and it varies from server to server, and sometimes even in the same server time to time (review http://support.microsoft.com/kb/2806535). Following are some considerations:

(a)   In a SharePoint implementation, it is highly recommended by Microsoft to use MAXDOP=1.
(b)   If parallelism introduces blocking on CXPACKET, lowering the MAXDOP setting may help.
(c)    In a system, if there is an enormous amount of spinlock and latch contention occurring, lowering the MAXDOP value will help to improve the performance.
(d)   Consider increasing “cost threshold for parallelism” to fine tune the parallelism along with or instead of MAXDOP.
(e)   In case of high CAXPACKET, consider redesigning indexes, removing fragmentations and updating statistics instead of changing MAXDOP.
(f)     Please remember that creating or rebuilding an index will suffer from lower values of MAXDOP.

Transaction Log:  Following are the recommendations for the Transaction Log:
(a)   Place the transaction log in a dedicated drive.
(b)   Do not create multiple transaction logs for a single database.
(c)    Pre-size the log file well in advance; use 4G or 8GB increments per growth.


Database Integrity: Make sure that the “Page Verify” option for all databases is set to “CHECKSUM”. Running DBCC CHECKDB in production server is resource intensive and it does not help to protect the database from corruption. Instead of running DBCC CHECKDB, consider configuring SQL Server “Event Alert Service” for database fatal error (Severity from 022 to 025) and get notifications right away.

PowerShell Way: Automating Golden Gate Replication Monitoring on Windows

$
0
0
Recently I had the opportunity to work with our Tandem Team to implement an Automate Monitoring and Alerting solution while replicating data from Tandem Data source to SQL Server 2012 using Oracle Golden Gate Replication technology. The Golden Gate replication pushes data 24/7 basis to SQL Server and once in a while, the latency increases or sometimes one or more “REPLICAT” stops working. As this is a mission critical system, we need to learn any malfunction almost immediately.

Golden Gate on Windows:
As the GG (Golden Gate) replication sits on Windows Server and runs all its services, it is quite easy to investigate the GG replication status manually. There are sets of commands provided by the GG mechanism to understand the replication configuration, status and the health of each or all REPLICATs. For example, as we are interested on replication status we need to utilize the GG Command “STATUS ALL” to see the “ABENDED”, “STOPPED”, “LAG” or “CHKPT” status of each REPLICAT.

Say for example, the GG Replication is running Windows on D:\GGReplication, and to see the status we need to do the following.

1.      Use CMD.exe and go to the “D:\GGReplication” folder;
2.      Run “GGSCI” to get into the GG replication;
3.      Execute the Command “STATUS ALL” or “INFO ALL”.

PowerShell Way:
There is no direct command to grab status information of the Golden Gate replication. However, we can utilize PowerShell “Invoke-Expression” to perform the above task from inside PowerShell sessions. Following is the PowerShell function I have developed to monitor the Golden Gate replication from PowerShell.

PowerShell Function to monitor Golden Gate Replication:


<####################################
# Golden Gate Status Monitor
# Developed: Sarjen Haque
#####################################>

functionGet-Replicat
{
     $string="CMD /c echo Status All | D:\GGReplication\GGSCI"
     $result=Invoke-Expression$String
     $raw=$result-match'REPLICAT'
    
     [StringSplitOptions]$Options="RemoveEmptyEntries"
    
     # loop through each line and break
     foreach ($linein$raw)
     {
           $wrd=$line.Split("",$Options)
           $lg=$wrd[3].Split(":")
           $tm=$wrd[4].Split(":")
                    
           $result=[Ordered]@{
                    "Program"=$wrd[0];
                    "Status"=$wrd[1];
                    "Name"=$wrd[2];
                    "LagMin"=[int]$lg[0]*60+[int]$lg[1];
                    "Lag"=$wrd[3];
                    "ChkPt"=$wrd[4];
                    "ChkPtMin"=[int]$tm[0]*60+[int]$tm[1];
           }
           $obj=New-Object-TypeNamePSObject-Property$result
           Write-Output$obj
          
     }
}


We have our PowerShell function, now we can use this function in various way to collect the Golden Gate replication status.  Following are some examples:

Example #1: Collect all “REPLICAT” status

Get-Replicat|ft-AutoSize


Example #2: Collect “REPLICAT” status if the LAG is greater than 15 minutes or if a REPLICAT is “ABENDED”

Get-Replicat|where-object { $_.LagMin -ge15-or$_.Status -eq'ABENDED' }|ft-AutoSize


Example #3: Collect “REPLICAT” status if “ABENDED”

Get-Replicat|where-object { $_.Status -eq'ABENDED'}|ft-AutoSize


Example #4: Collect “REPLICAT” status if stopped

Get-Replicat|where-object { $_.Status -eq'STOPPED'}|ft-AutoSize


Automating Golden Gate Process Monitoring:
By utilizing the above “Get-Replicat” function, we can easily automate the process monitoring and send alerts if a performance condition exists based on provided criteria. A Windows Schedule task can be created to execute that PowerShell script every x minutes to check the “REPLICAT” status.

You can download this entire scripted Golden Gate monitoring solution on Windows from my shared Dropbox folder. The output of the script is similar to the one below.

Steps to follow:
  1. Download the script from http://bit.ly/1cZNScb.
  2. Create or import a windows task (provided along with the script).
  3. Change the Location of the GG binaries location in the function “Get-Replicat”.
  4. Change the smtp server name and email address for mailing functionality.


Conclusion: I have used one my favorite PowerShell Guru’s (Don Jones, MVP, www.powershell.org) library function for HTML reporting. I believe that someone will benefit from this simple function. Let me know if you find it useful.

PowerShell Way: Automating SQL Server blocking capture, alert and notification

$
0
0
Capturing SQL Blocking is a challenge. Although there are lot of mechanisms out there to accomplish this task, not all of them are efficient and easy to implement. In an OLTP environment, database blocking is obvious, but excessive blocking reduces transaction throughput severely.  Often blockings become a nightmare and bring the server into a state where normal business activities suffer.


The goal of this PowerShell Script is to capture the blocking when it occurs along with all the details and to notify the concerned group immediately so that an appropriate corrective action can be taken quickly.  This script is lighting fast and very efficient in performing what it is supposed to do. The automation process has been developed by using PowerShell and DMVs. A windows task can be used to execute the script against any SQL Server from edition 2005 to 2014.


The Script:
The main script (SQLBlocking-V2.ps1) contains a CSS style sheet, and two PowerShell functions:  “Send-EmailToSupport” and “Get-SQLBlocking”. There is one HTML formatting library function (written by Don Jones, MVP, www.powershell.org). At the bottom of the script, the main function“Get-SQLBlocking” has been called by providing different parameters and these are follows:

-Server = SQL Server instance
-CheckEverySeconds = How often script will check for blocking
-DurationToReport = Blocking duration to report.
-RunUntil = at what time it will stop.

How to execute?
We can create a Windows task to run the script. Once the script has started execution, it creates a connection to the database server and keep running in a loop for an allotted time while holding the connection. The script is using Windows Authentication while connecting to SQL Server.

Example:
The “SQLBlocking-V2.ps1” can be run directly from the PowerShell or we can run the script using Windows Tasks or SQL Agent Job. This script will run for 24 hours checking every 20 seconds for blockings; if there is a blocking that occurs for more than 30 seconds, the script will catch the blocking and send an immediate email to the support group.

Steps:
1.      Create a Windows task from a local or remote machine.
2.      Schedule the task to start at 12:01AM.
3.      Call the “Get-SQLBlocking” as follows.

Get-SQLBlocking-Server'SHB_MAIN\SQL2012'-CheckEverySeconds 20 -DurationToReport 30000 -RunUntil'11:55:00 PM'

Conclusion:
This article is on how to capture a SQL Server blocking for Alert/Notification purposes and this Automation (PowerShell Script) is well-tested against our heavy duty production server without any deficiencies. I am providing it “AS IS” and I hope that you will find it useful.

Buffer Pool Extension (BPE) in SQL 2014 - A brief introduction

$
0
0
What is Buffer Pool (BP)?
The Buffer Pool (also known as the buffer cache) is a shared memory area which consists of data/index pages. A buffer page is 8KB in size and the Max Server Memory determines the total size of the Buffer Pool. For example, when we set max server memory=16GB, it means we are allocating 16GB of memory to the Buffer Pool. The plan cache is also the part of the Buffer Pool.

What is Buffer Pool Extension (BPE)?
This is a new feature in SQL 2014 where we can extend the Buffer Pool beyond the limitation of the maximum physical memory. This means that we can use a persistent disk file system as part of the buffer. The file can be placed in any disk including the network shared folder.

Suitability of BPE:
The primary goal of BPE implementation is to improve Read performance of an OLTP application where physical memory is less than 64GB (according MSDN blogs). The application which is more READ intensive and less WRITE prone, implementing this feature will enhance I/O performance greatly. However, this feature is not suitable for data warehouse and WRITE intensive type workload.

Where to place the file?
The SSD provides very low random and read access latency, thus the best place to put the BPE file in a SSD. If it is placed in a normal disk system, there will be a negative impact on I/O.

BPE size:
The BPE size can be 32 times greater than Max Server’s Memory. So if we set Max Server Memory to 4 GB, then BPE can be 4X32 GB = 128 GB. Microsoft recommends 4 to 8 times of the amount of Max Server Memory which will be an optimal size for overall I/O performance.

What will be written in a BPE file?
The BPE file only holds “clean pages” in it. A “clean page” (aka un-modified page) is a data or index page which is exact and equivalent to a disk page residing in the data file. A BPE file will not hold any “dirty pages” at any time.

Good to know and good practices:
Before taking advantage of the features of BPE, we should be sure that adding extra physical memory is not an option due to hardware limitation. In addition to this, we should have optimal T-SQL code and we should not have I/O overhead index schema such as overlapping, duplicating and multi-column indexes.

1.      Placing the BPE file in a high performance SSD is recommended.
2.      Make sure the disk alignment is correct.
3.      Consider formatting the disk with 64K block (cluster) size.
4.      Set the Max Server Memory and leave enough memory for the OS.
5.      “Lock pages in Memory” has no interaction with BPE.
6.      Before modifying the BPE, the Buffer Pool Extension feature should be disabled first.
7.      When the BPE is disabled, all related configuration settings are removed automatically and the memory used to support the feature is not reclaimed until the instance of SQL Server is restarted. The Buffer Pool Extension file will be deleted once the instance of SQL Server is shutdown.
8.      BPE can be configured and disabled at any time while the instance of SQL Server is running. If the feature is re-enabled, the memory will be reused without restarting the instance.
9.      As BPE contains only clean pages, data loss is out of question.

How to configure BPE:
Configuring BPE is very straight forward and simple. Following are the steps we need to follow to configure a 16GB BPE file when the Max Server Memory is set to 4GB.

Set the “max server memory” to 4GB:
EXECsp_configure'max server memory (MB)', 4096
GO
RECONFIGURE

Configure the Buffer Pool Extention to 16GB:
ALTERSERVER CONFIGURATION
SETBUFFERPOOL EXTENSION ON
    (FILENAME='E:\SQLBuffer\ExtendedBuffer.BUF', SIZE = 16 GB);

To see the configuration, execute following DMV query:
SELECT* FROM   sys.dm_os_buffer_pool_extension_configuration

To turn off the BPE feature, simply execute the following: 
ALTERSERVER CONFIGURATION
SETBUFFERPOOL EXTENSION OFF

Querying BPE utilization:
The following query can be used to identify utilization of BPE:
SELECTCASE
            WHEN database_id =32767 THEN'ms_resource_db'
            ELSEDB_NAME(database_id)
       END       AS database_name,
       COUNT(*)  AScached_pages_count,
       CONVERT(NUMERIC(25, 4),COUNT(row_count)* 8.00 / 1024.00)AS size_mb,
       CONVERT(
           NUMERIC(25, 4),
           COUNT(row_count)* 8.00 / 1024.00 / 1024.00
       )         AS size_gb
FROM   sys.dm_os_buffer_descriptors
WHERE  is_in_bpool_extension = 1
GROUPBY
       database_id

    
Performance measurement of BPE:
There are some performance counters that have been introduced in SQL 2014 to measure BPE performance. It can be monitored using Windows PerfMon or with T-SQL. Following is the T-SQL query:

SELECT [object_name],counter_name, instance_name, cntr_value
FROM   sys.dm_os_performance_counters
WHERE  [object_name] LIKE'%Buffer Manager%'
       AND [counter_name] LIKE'%Extension%'


References:
Buffer Pool Extension

Buffer Pool Extension to SSDs in SQL Server 2014

Creating SQL Server Transactional Replication from a Transaction Log backup

$
0
0
There are situations where creating a transactional replication by using the most preferable snapshot method is not acceptable in terms of the performance impact or the long duration caused by the snapshot process. So there are alternatives to create transaction replications by just using a full database backup and creating the subscriber using the transaction log backup.

If we use a native SQL backup to create the replication, then the process is very straight forward. However, if you use any third party backup solution, they sometimes can’t be used to create transactional replications as the SQL Replication Command “sp_addsubscription” may be incompatible with them. In this case, we only need a “SQL Native Transaction Log Backup” before creating the subscriber. So whether we have a native SQL Backup or third party backup solution put in place, the fundamental process is the same.

0.0: Steps summary:
In summary, we need to follow the same basic principles while creating the replication from backup (database and log).
1.      Take a full database backup (using SQL Native or third party).
2.      Start restoring the full backup on the subscriber(s).
3.      Create the publication on the publisher server while backup is being restored on the subscriber.
4.      Restore all the t-log backups on the subscriber (SQL native or third-party).
5.      Take the last SQL Native t-log backup on the publisher and use this log to bring the subscriber database online.
6.      Use the “sp_addsubscription” to create the subscriber from the t-log.

The guidelines are equally applicable when creating transactional replication regardless if a SQL Native Backup or a third party backup has been implemented.

1.0: Snapshot and performance Impact:
As the backup will be used instead of snapshot method to create and to sync the subscriber, there will be no performance impact such as blocking, network traffic and high I/O as the snapshot method is not involved with the subscriber synchronization process.

1.1: Third Party backup and SQL Replication:
1.      The native SQL Database backup and SQL Transaction Replication command are fully compatible.
2.      The internal SQL replication command can’t read the header of third-party backup files and is incompatible. Therefore the backups (database or log) which are taken using third party-tools can’t be used to create transactional replications. A native SQL transactional log backup is required to sync the subscriber.

1.3: Adding a new or broken Subscriber:
1.      If one or more subscriber is broken, then we can rebuild the broken subscriber.
2.      We can add additional subscribers whenever it is required.

1.4: Tips to use third party backup (database and log):
1.      Restore all database and log backups on the subscriber servers which are taken with the third-party tool.  The SQL Server native log-shipping method or using a third party tool such as “Idera SQL Safe” can be used to perform this task.
2.      Before attaching a subscriber to the replication process, perform a Native SQL Transaction log backup and apply this latest T-Log backup to each subscriber with the RECOVERYoption.
3.      Use the SQL replication command (sp_addsubscription) with the native T-Log backup (usually TRN) to create one or more subscriptions.

2.0: Step-by-step: Steps to create a brand new transactional replication from a database backup and the log:
1.      Create a network share folder for snapshot so that the SQL Server account can be accessed from anywhere (Although it will not be used).
2.      Configure the distributor server.
3.      Add the publisher server to the distributor server.
4.      Disable (or comment out the job script) the SQL Agent Job “Distribution clean up: distribution” on the distribution server. Watch for the distribution database size.
5.      Take a Full database backup of the publisher database.
6.      Start restoring the FULL DATABASE BACKUP to the subscriber servers with the “NORECOVERY” option.
7.      Restore one or more log backups after the last full backup.
8.      Create the publication on the publisher server.
9.      Change the subscription initialization option by using GUI (figure#1) or by using the following command on the publishing server.

--We need to set option 'allow Initialization from backup' on the Publication
EXECsp_changepublication
     @publication='TestDBPub', 
     @property='allow_initialize_from_backup',
     @value='true'

10.  Stop any log backups on the publisher database and take a Last SQL Native Transaction Log backup of the publisher database.
11.  Restore the last t-log backup on the subscriber server with “WITH RECOVERY” option.

RESTORE LOG TestDB 
FROM DISK='X:\DBBackups\reptestdb_010.TRN' WITH RECOVERY

12.  On the publisher server, execute the following command to add the subscriber:

-- Add subscription specifying the “SQL Native LAST T-LOG Backup file name” to use for initializing.
-- To add “SRV123” as a subscriber execute the same script by changing the @subscriber parameter.
EXECsys.sp_addsubscription
     @publication='TestDBPub',
     @subscriber='SRV123',
     @destination_db='TestDB',
     @subscription_type='Push',
     @sync_type='initialize with backup',
     @backupdevicetype='Disk',
     @backupdevicename='X:\DBBackups\reptestdb_010.TRN'

13.  Once all the subscribers are added and the replication is up and running, enable the “Distribution clean up: distribution” job.
14.  Restart the log backup if it was stopped earlier.

figure#1: Publication properties

2.1: Re-establish a broken subscriber:
1.      Cleanup the broken subscription (one or more).
2.      Disable the “Distribution clean up: distribution” SQL Agent Job.
3.      Use the last full backup of the published database to restore on the subscriber server.
4.      Perform the steps from #10 to #14.

2.2: Steps add a new subscriber:
1.      Disable the “Distribution clean up: distribution”SQL Agent Job.
2.      Use the full backup of the published database to restore on the subscriber server.
3.      Perform the steps from #10 to #14.

3.0: Re-establish a Third party Log-shipping if any:
If a native SQL transaction log backup is performed in between, then that log needs to be applied manually on the log-shipped server. Because once a native t-log backup is taken, the third-party log-shipping process, such as log-shipping process of Idera, will start failing.

1.      Restore one or more t-logs which was taken through the native SQL backup method on all log-shipped servers. Syntax for log-shipped server:

      RESTOREDATABASE abcDB
        FROMDISK='X:\DBBackups\reptestdb_010.TRN'
        WITHSTANDBY='X:\DBBackups\my_undo_file_name.uno'  

2.      Re-establish the third-party log-shipping process.

4.0: VLF and replication:
Excessive number of VLF slows down the log reader agent and the replication performance, and therefore it is recommended to resize the number of VLF before creating the transactional replication. Kimberly Tripp has a great article; read it here “Transaction Log VLFs – too many or too few?” - http://www.sqlskills.com/blogs/kimberly/transaction-log-vlfs-too-many-or-too-few/

Controlling the “ERRORLOG” – size and number of log files

$
0
0
SQL Server “ERRORLOG” is a vital tool for DBAs and Developers in order to understand various events that are logged in it. Thus, maintaining its growth and keeping the number of log files is important.

1.0: Number of “ERRORLOG”.
We can keep up to 99 “ERRORLOG” files while 6 are default. To increase the number of “ERRORLOG”s, we can use the SSMS directly or we can use the extended Stored Procedure “xp_instance_regwrite”.

1.0.1: SQL Server 2005 to SQL Server 2014: To have 99 “ERRORLOG”s, execute the following query:

USE[master]
GO
EXECxp_instance_regwriteN'HKEY_LOCAL_MACHINE'
    ,N'Software\Microsoft\MSSQLServer\MSSQLServer'
    ,N'NumErrorLogs'
    ,REG_DWORD
    ,99
GO

To perform the same task using SSMS, expand the “Management” node in the Object Explorer, and right click the “SQL Server Logs” and select “configure”.

Figure #1:Number of log setting in SSMS


2.0: Size of “ERRORLOG”:
SQL Server 2005 to 2008 Errorlog size can only be managed manually. While SQL 2012 onwards, a mechanism has been built within the tool to control the “ERRORLOG” size automatically.

2:0.1: SQL Server 2005 to SQL Server 2008: The following query can be used to determine the size of the current “ERRORLOG”. Based on this size, the “ERRORLOG” then can be recycled. A scheduled SQL Agent job can do this trick:

SETNOCOUNTON
CREATETABLE #Errorlog
(
       ArchiveNo           INT
   ,ArchiveDate         DATETIME
   ,LogFileSizeBtye     BIGINT
);
      
INSERTINTO #Errorlog
EXECxp_enumerrorlogs

IF (
       SELECT dt.LogFileSizeMB
       FROM   (
                  SELECT e.ArchiveNo
                        ,e.ArchiveDate
                        ,(e.LogFileSizeBtye/1024)AS LogFileSizeKB
                        ,(e.LogFileSizeBtye/1024)/1024 AS LogFileSizeMB
                  FROM   #Errorlog e
                  WHERE  e.ArchiveNo =0
              ) dt
   )>=10 -- if errorlog is more than 10mb
BEGIN
    PRINT'Recycling the error log'
    DBCC ErrorLog -- recycle the errorlog
END
      
DROPTABLE #Errorlog

2.0.2: SQL Server 2005 to SQL Server 2014:To control the “ERRORLOG” size starting from SQL Server 2014, we can execute the following query to set the desired log size in KB.  In the following example we have set the log size as 10MB (10240 KB).

USE [master];
GO
EXECxp_instance_regwriteN'HKEY_LOCAL_MACHINE'
    ,N'Software\Microsoft\MSSQLServer\MSSQLServer'
    ,N'ErrorLogSizeInKb'
    ,REG_DWORD
    ,10240;

GO

“ANSI_NULLS”, “JOIN/WHERE” and “Query Optimizer” - story of the three stooges

$
0
0

A friend of mine who lives in Nova Scotia is managing a couple of large busy OLTP database servers. A few days ago, he asked me curiously, what’s going on with “ANSI_NULLS” here. Although, the “ANSI_NULLS” setting is simple but the misconfiguration or misuse of this setting can cause unbelievable performance impact. From my experience, I have seen many experts getting stressed to resolve this mysterious performance issue or to find out the root cause.


There is a very close relation among “ANSI_NULLS”, “JOIN/WHERE” and “Query Optimizer” when a query and its search column contains NULL values. Microsoft SQL Server suggests that when a Stored Procedure (P), Trigger (T), and others get created the following two settings must be executed right before creating or modifying any P, V, IV, IF, FN, T and TF from the same connection. For example,

SETANSI_NULLSON
GO
SETQUOTED_IDENTIFIERON
GO

CREATE/ALTERPROCEDUREusp_PROC
AS
    BEGIN
       -- T-SQL Code goes here
    END
GO

The “ANSI_NULLS” setting is basically for SQL Server Query optimizer. That said, when the Query Optimizer creates an Execution Plan it checks the Index and table properties to incorporate any object level settings specified when a stored procedure is created. So if the “ANSI_NULLS” is tuned off then SQL Server Query Optimizer must first scan the table or index for “NULL” and then filter the result set with a “SORT” operator. This query execution behavior is by design.

MSDN explains “ANSI_NULLS” as follows:

1.      When SET ANSI_NULLS is ON, a SELECT statement that uses WHERE column_name = NULL returns zero rows even if there are null values in column_name. A SELECT statement that uses WHERE column_name <> NULL returns zero rows even if there are nonnull values in column_name.

When SET ANSI_NULLS is ON, all comparisons against a null value evaluate to UNKNOWN. When SET ANSI_NULLS is OFF, comparisons of all data against a null value evaluate to TRUE if the data value is NULL. If SET ANSI_NULLS is not specified, the setting of the ANSI_NULLS option of the current database applies.

2.      When SET ANSI_NULLS is OFF, the Equals (=) and Not Equal To (<>) comparison operators do not follow the ISO standard. A SELECT statement that uses WHERE column_name = NULL returns the rows that have null values in column_name. A SELECT statement that uses WHERE column_name <> NULL returns the rows that have nonnull values in the column. Also, a SELECT statement that uses WHERE column_name <> XYZ_value returns all rows that are not XYZ_value and that are not NULL.

The “ANSI_NULLS” setting can be overridden explicitly by putting the command in the top of the batch or inside the stored procedure. However, doing so will prevent plan reuse and query will be recompiled in every execution.

Good Practices and Good to Know:
1.      Always use “SET ANSI_NULLS ON” while creating stored procedures or indexes.
2.      Avoid using “SET ANSI_NULLS” inside a stored procedure.
3.      Indexed view and computed column requires “SET ANSI_NULLS ON” otherwise “UPDATE/INSERT” will fail.
4.      “LEFT JOIN” usually a costly operation; try to use “INNER JOIN” if possible.
5.      Use more filters on the “JOIN" or “WHERE” clause.
6.      Use “IS NULL” or “IS NOT NULL” keyword with the “JOIN” or the “WHERE” clause.
7.      Misuse of “ANSI_NULLS” causes parameter sniffing.
8.      “ANSI_NULLS” setting can be changed server-wide, per database basis and in a T-SQL batch/stored procedure.


Caution:
“In a future version of SQL Server, ANSI_NULLS will always be ON and any applications that explicitly set the option to OFF will generate an error. Avoid using this feature in new development work, and plan to modify applications that currently use this feature.”

Default SET Commands:

SET
Command
Applications using
ADO .Net, ODBC or OLE DB
SSMS,
Query Analyzer
SQLCMD,
OSQL, BCP,
SQL Server Agent
ISQL,
DB-Library
ANSI_NULL_DFLT_ON
ON
ON
ON
OFF
ANSI_NULLS
ON
ON
ON
OFF
ANSI_PADDING
ON
ON
ON
OFF
ANSI_WARNINGS
ON
ON
ON
OFF
CONACT_NULLS_YIELD_NULL
ON
ON
ON
OFF
QUOTED_IDENTIFIER
ON
ON
OFF
OFF
ARITHABORT
OFF
ON
OFF
OFF

Observing the Query Execution Behavior:
We will examine the query execution behavior with or without the “ANSI_NULLS” setting. Later we will try to optimize the Query so that it will run in any setting conditions.
Testing the Behavior:
1.      Create a sample database and two tables.
2.      Add records with and without “NULL” values.
3.      Create clustered key and index.
4.      Create Stored Procedure with ON and OFF settings.
5.      Rewrite the query to deal with any situations.

Script to Create database and tables:

SETNOCOUNTON
IFOBJECT_ID('tblLarge')ISNOTNULL
   DROPTABLEtblLarge
GO

CREATETABLEtblLarge
       (
         xIDINTIDENTITY(1, 1),
         sName1VARCHAR(100),
         sName2VARCHAR(1000),
         sName3VARCHAR(400),
         sIdentifierCHAR(100),
         dDOBDATETIMENULL,
         nWageNUMERIC(20, 2),
         sLicenseVARCHAR(25)
       )
GO

/******************************************************
Add 1000 or more/less records with non-blank dDOB
******************************************************/
SETNOCOUNTON
INSERT  INTOtblLarge
        (sName1,
          sName2,
          sName3,
          sIdentifier,
          dDOB,
          nWage,
          sLicense
        )
VALUES  (LEFT(CAST(NEWID()ASVARCHAR(36)),RAND()* 50),    -- sName1
          LEFT(CAST(NEWID()ASVARCHAR(36)),RAND()* 60),    -- sName2
          LEFT(CAST(NEWID()ASVARCHAR(36)),RAND()* 70),    -- sName2
          LEFT(CAST(NEWID()ASVARCHAR(36)), 2),              -- sIdentifier    
          DATEADD(dd,-RAND()* 20000,GETDATE()),            -- dDOB or NULL
          (RAND()* 1000 ),                                  -- nWage
          SUBSTRING(CAST(NEWID()ASVARCHAR(36)), 6, 7)        -- sLicense       
        )
GO 1000


/******************************************************
Add 1000 or more/less records with dDOB = NULL
******************************************************/
SETNOCOUNTON
INSERTINTOtblLarge
(sName1,
sName2,
sName3,
sIdentifier,
dDOB,
nWage,
sLicense
)
VALUES(LEFT(CAST(NEWID()ASVARCHAR(36)),RAND()* 50),-- sName1
LEFT(CAST(NEWID()ASVARCHAR(36)),RAND()* 60),-- sName2
LEFT(CAST(NEWID()ASVARCHAR(36)),RAND()* 70),-- sName2
LEFT(CAST(NEWID()ASVARCHAR(36)), 2),-- sIdentifier
NULL,            -- dDOB is NULL
(RAND()* 1000 ),-- nWage
SUBSTRING(CAST(NEWID()ASVARCHAR(36)), 6, 7)-- sLicense
)
GO 1000

Create indexes and another small table:
CREATETABLE[dbo].[tblSmall](
                [sIdentifier][char](100)NOTNULL,
                [nCount][int]NULL)
GO

INSERTINTOtblSmallSELECTsIdentifier,COUNT(*)ASnCount
FROMtblLargeWHEREsIdentifierISNOTNULL 
GROUPBYsIdentifier
GO

ALTERTABLE[tblLarge]
ADD  CONSTRAINT[PK_tblLarge]
PRIMARYKEYCLUSTERED ([xID]ASC)

CREATENONCLUSTEREDINDEX[IX_dDOB]
ON[tblLarge]([dDOB]ASC)
INCLUDE([sIdentifier])

ALTERTABLE[tblSmall]
ADD  CONSTRAINT[PK_tblSmall]
PRIMARYKEYCLUSTERED ([sIdentifier]ASC)
GO

Script to create Stored Procedure:
We will create two Stored Procedures; one with “SET ANSI_NULLS” on and another with off.

-- stored procedure with "ANSI_NULLS ON"
SETANSI_NULLSON
GO
SETQUOTED_IDENTIFIERON
GO

CREATEPROC[dbo].[usp_ANSI_on]
    @dDOBASDATETIME,
    @sIdentifierASCHAR(100)
AS
    BEGIN
        SELECT  b.xID,
                b.sIdentifier,
                b.dDOB,
                a.nCount
        FROM    tblSmalla
                LEFTJOINtblLargebONa.sIdentifier=b.sIdentifier
        WHERE   a.sIdentifier=@sIdentifier
                ANDb.dDOB=@dDOB
    END
GO


-- stored procedure with "ANSI_NULLS OFF"
SETANSI_NULLSOFF
GO
SETQUOTED_IDENTIFIERON
GO

CREATEPROC[dbo].[usp_ANSI_off]
    @dDOBASDATETIME,
    @sIdentifierASCHAR(100)
AS
    BEGIN
        SELECT  b.xID,
                b.sIdentifier,
                b.dDOB,
                a.nCount
        FROM    tblSmalla
                LEFTJOINtblLargebONa.sIdentifier=b.sIdentifier
        WHERE   a.sIdentifier=@sIdentifier
                ANDb.dDOB=@dDOB
    END
GO


Executing two Stored Procedures:
From a new query window, run the two stored procedures and capture the actual execution plan. The following is my output from my test.

Figure# 1:Comparing the execution plans.


From the above actual execution plan, it seems that we need to create an index. So let’s create the missing index. Execute both SPs again.

CREATENONCLUSTEREDINDEX[IX_sIdentifier]
ON[tblLarge](  [sIdentifier]ASC)
INCLUDE(dDOB)


Figure# 2:Comparing the execution plans after creating the index.


Review and Analysis:
SQL Server now stopped asking to create missing indexes, but unfortunately it is still using a simillar execution plan with a "SORT Operator" even after clearing the cache.

1.      So, it makes sense that “ANSI_NULLS” has an effect on the execution plan.
2.      “ANSI_NULLS OFF” cannot use index even though the appropriate index is there.
3.      CPU and overall query cost will be high as it has to scan or seek all “NULL” values for further processes.

Resolving the issue:
To resolve the costing issue and to improve its performance, we can perform the following two options:

1.      Create or modify Stored Procedures with “SET ANSI_NULLS ON”.
2.      Rewrite the query; in our case we can move the “dDOB” after the “JOIN” clause. This will work regardless of the “ANSI_NULLS” setting.

CREATEPROC[dbo].[usp_ANSI_off_optimize]
    @dDOBASDATETIME,
    @sIdentifierASCHAR(100)
AS
    BEGIN
        SELECT  b.xID,
                b.sIdentifier,
                b.dDOB,
                a.nCount
        FROM    tblSmalla
                LEFTJOINtblLargebONa.sIdentifier=b.sIdentifier
                                        ANDb.dDOB=@dDOB
        WHERE   a.sIdentifier=@sIdentifier
    END
GO

--Using JOIN
CREATEPROC[dbo].[usp_ANSI_off_optimize_JOIN]
       @dDOBASDATETIME,
       @sIdentifierASCHAR(100)
AS
       BEGIN
              SELECTb.xID,
                    b.sIdentifier,
                    b.dDOB,
                    a.nCount
             FROM   tblSmalla
                    JOINtblLargebONa.sIdentifier=b.sIdentifier
                                       ANDb.dDOB=@dDOB
             WHERE  a.sIdentifier=@sIdentifier
        END
 GO


Query to Identify “ANSI_NULLS” setting:
To identify where “ANSI_NULLS” ( as well “QUOTED_IDENTIFIER”) were used when Stored Procedures were created, the following query can be used.

/*******************************************
** Following two settings must be ON
** SET ANSI_NULLS ON
** SET QUOTED_IDENTIFIER ON
*******************************************/
SELECT  SCHEMA_NAME(s.schema_id)+'.'+s.nameASname,
        s.create_date,
        s.modify_date,
        (CASEWHENOBJECTPROPERTY(s.object_id,'ExecIsQuotedIdentOn')= 1 THEN'ON'
               ELSE'OFF'
          END)AS'Setting of QUOTED_IDENTIFIER at creation time',
        (CASEWHENOBJECTPROPERTY(s.object_id,'ExecIsAnsiNullsOn')= 1 THEN'ON'
               ELSE'OFF'
          END)AS'Setting of ANSI_NULLS at creation time'
FROM    sys.objectss
WHERE   s.typeIN('P','TR','V','IF','FN','TF')
        ANDOBJECTPROPERTY(s.object_id,'ExecIsQuotedIdentOn')= 0
        ANDOBJECTPROPERTY(s.object_id,'ExecIsAnsiNullsOn')= 0
ORDERBYs.nameASC

References:
SET ANSI_NULLS (Transact-SQL)
http://msdn.microsoft.com/en-CA/library/ms188048.aspx

OBJECTPROPERTY (Transact-SQL)
http://msdn.microsoft.com/en-us/library/ms176105.aspx

Slow in the Application, Fast in SSMS? Understanding Performance Mysteries.
http://www.sommarskog.se/query-plan-mysteries.html

WRITELOG waittype - Implicit vs. Explicit Transaction: disk or coding issue?

$
0
0
In a OLTP system where concurrency is high observing WRITELOG waittype is normal for a short period of time during peak usage. Generally, a high value of this waittype indicates slow response of the application. So, observing this waittype for a longer period of time and repeatedly for DML operations such as MERGE, INSERT, UPDATE and DELETE, obviously this indicates two specific issues:

1.      Disk I/O sub-system
2.      Transaction handing

If the underlying disk sub-system is the best in the industry and configured correctly, investigation shows nothing suspicious around I/O and if we still see the WRITELOG waittype then it is obviously the result of poor or improper handling of Transactions in a SQL batch.

Figure #1: WRITELOG waittype in a live system
Let’s explain what WRITELOG waittype is. This is a log management system waiting for dirty data pages to write on the disk. This waittype indicates that the SPID is waiting for a transaction log I/O request to be completed.  Thus if the number of WRITELOG waittype is high that means there are a number of requests in the queue which are processing slowly. Although, many experts and even MS KB article (KB822101) indicates it is a disk bottleneck, in reality this may not be the case unless your disk system is IDE or SATA based or configured incorrectly. We need to investigate one more area before confirming that the disk is an issue.

Implicit and explicit transaction:
As the WRITELOG waittype is related to the transaction log management system, let’s try to understand the difference between the two.

SQL Server handles two types of transaction mode:
(a)   Implicit transaction
(b)   Explicit transaction

Implicit transaction: In Implicit transaction mode, the instance of the SQL Server Database Engine automatically starts a new transaction after the current transaction is committed or rolled back for each DML statement. We do not need to define the start of a transaction; each statement level transaction will be committed or rolled back automatically.

Implicit transaction can be turned on or off per batch basis. We can use the “SET IMPLICIT_TRANSACTIONS ON/OFF” statement to turn implicit transaction mode off. We can use the “COMMIT TRANSACTION” or “ROLLBACK TRANSACTION” statements to end each transaction.

Explicit transaction: An explicit transaction is one in which we explicitly define both the starting and ending of the transaction. To start an explicit transaction, we can use “BEGIN TRANSACTION” and then complete the transaction by using “COMMIT TRANSACTION” or “ROLLBACK TRANSACTION”.

The main difference between Implicit and Explicit transaction is that implicit transaction is auto, controlled by SQL Server Engine and statement level transaction, whereas explicit transaction is user defined and batch-scoped transaction. Some key comparisons are follows:

Indicator
Implicit Transaction
Explicit Transaction
Scope
Statement level
Batch level
Log generation
continuous chain of transactions
One transaction log entry
Log I/O
For each statement gets one I/O
Entire batch needs one I/O
WRITELOG Waittype
Sustained period of time
N/A or unless there is real disk issue
Response/duration
Longer due to several I/O activities
Fast, less I/O activities
T-Log Restore
Long, Redo/undo phase
Short redo/undo phase
Impact on T-Log
Extremely high
Less and insignificant
Write Duration
Longer and slow
Shorter and fast


The application which is utilizing the Implicit Transaction mechanism actually makes the I/O system busy and degrades application response time dramatically. As a result, various disk related performance counters show significantly high values and we start believing that the disk is the bottleneck.

Observing the WRITLOG waittype:
In the following test we will review how implicit and explicit transaction incurs WRITELOG waittype. The given script can be executed in any version of SQL Server and with any kind of disk system to understand the behavior.

Complete T-SQL Code to produce the behavior:
/******************************************************
** Implicit vs Explicit Transaction
** Author: Sarjen Haque
** Apply to: SQL 2005 to 2012
******************************************************/
DBCCSQLPERF('sys.dm_os_wait_stats',CLEAR);

IFOBJECT_ID('tempdb..#wait')ISNOTNULL
   DROPTABLE#wait
GO

/*************************************
** Create a test database
*************************************/
USE[master]
GO
IFEXISTS(SELECT  name
            FROM    sys.databases
            WHERE   name=N'TestDB')
   BEGIN
         ALTERDATABASE[TestDB]SET  SINGLE_USERWITHROLLBACKIMMEDIATE
         DROPDATABASE[TestDB]
   END
GO

CREATEDATABASETestDB
GO

USETestDB
GO
/*************************************
** Create a a table
*************************************/
SETNOCOUNTON
IFOBJECT_ID('tblLarge')ISNOTNULL
   DROPTABLEtblLarge
GO

CREATETABLEtblLarge
       (
         xIDINTIDENTITY(1, 1),
         sName1VARCHAR(100),
         sName2VARCHAR(1000),
         sName3VARCHAR(400),
         sIdentifierCHAR(100),
         dDOBDATETIMENULL,
         nWageNUMERIC(20, 2),
         sLicenseVARCHAR(25)
       )
GO
/*************************************
** Perform a checkpoint
*************************************/
CHECKPOINT


/*************************************
** Collect initial wait stats
*************************************/
SELECT  'w1'WaitRun,
        wait_type,
        wait_time_ms/ 1000.0 ASWaitSec,
        (wait_time_ms-signal_wait_time_ms)/ 1000.0 ASResourceSec,
        signal_wait_time_ms/ 1000.0 ASSignalSec,
        waiting_tasks_countASWaitCount
INTO    #Wait
FROM    sys.dm_os_wait_stats
WHERE   wait_typeLIKE'WRITELOG%'

GO
/*************************************
** Using explicit Transaction
*************************************/
SETNOCOUNTON
USETestDB
GO

DECLARE@nINT
SET@n=1

BEGINTRANSACTION
WHILE@n<= 10000
      BEGIN
            INSERT  INTOtblLarge
                    (sName1,
                      sName2,
                      sName3,
                      sIdentifier,
                      dDOB,
                      nWage,
                      sLicense
                    )
            VALUES  (LEFT(CAST(NEWID()ASVARCHAR(36)),RAND()* 50),    -- sName1
                      LEFT(CAST(NEWID()ASVARCHAR(36)),RAND()* 60),    -- sName2
                      LEFT(CAST(NEWID()ASVARCHAR(36)),RAND()* 70),    -- sName2
                      LEFT(CAST(NEWID()ASVARCHAR(36)), 2),              -- sIdentifier    
                      DATEADD(dd,-RAND()* 20000,GETDATE()),            -- dDOB
                      (RAND()* 1000 ),                                  -- nWage
                      SUBSTRING(CAST(NEWID()ASVARCHAR(36)), 6, 7)        -- sLicense       
                    )
            SET@n=@n+ 1
      END
COMMITTRANSACTION

GO
/***************************************
** Collect wait stats for Explicit TRN
***************************************/
INSERT  INTO#wait
        SELECT  'w2'WaitRun,
                wait_type,
                wait_time_ms/ 1000.0 ASWaitSec,
                (wait_time_ms-signal_wait_time_ms)/ 1000.0 ASResourceSec,
                signal_wait_time_ms/ 1000.0 ASSignalSec,
                waiting_tasks_countASWaitCount
        FROM    sys.dm_os_wait_stats
        WHERE   wait_typeLIKE'WRITELOG%'
GO
/*****************************************
** Check for Log flush for Explicit TRN
*****************************************/
SELECT  'Explicit'ASTransaction_Type,
        SPID,
        Operation,
        COUNT(Operation)[OperationCount],
        [Transaction Name],
        COUNT([Transaction Name])AS[TransactionNameCount]
FROM    ::
        fn_dblog(NULL,NULL)
WHERE   operationLIKE'%LOP_BEGIN_XACT%'
        AND[SPID]=@@spid
        AND[SPID]ISNOTNULL
GROUPBYSPID,
        Operation,
        [Transaction Name]
GO

/************************************
** Using implicit Transaction
************************************/
SETNOCOUNTON
USETestDB
GO

DECLARE@nINT
SET@n=1

WHILE@n<= 10000
      BEGIN
            INSERT  INTOtblLarge
                    (sName1,
                      sName2,
                      sName3,
                      sIdentifier,
                      dDOB,
                      nWage,
                      sLicense
                    )
            VALUES  (LEFT(CAST(NEWID()ASVARCHAR(36)),RAND()* 50),    -- sName1
                      LEFT(CAST(NEWID()ASVARCHAR(36)),RAND()* 60),    -- sName2
                      LEFT(CAST(NEWID()ASVARCHAR(36)),RAND()* 70),    -- sName2
                      LEFT(CAST(NEWID()ASVARCHAR(36)), 2),              -- sIdentifier    
                      DATEADD(dd,-RAND()* 20000,GETDATE()),            -- dDOB
                      (RAND()* 1000 ),                                  -- nWage
                      SUBSTRING(CAST(NEWID()ASVARCHAR(36)), 6, 7)        -- sLicense       
                    )
            SET@n=@n+ 1
      END

GO
/***************************************
** Collect wait stats for Implicit TRN
***************************************/
INSERT  INTO#wait
        SELECT  'w3'WaitRun,
                wait_type,
                wait_time_ms/ 1000.0 ASWaitSec,
                (wait_time_ms-signal_wait_time_ms)/ 1000.0 ASResourceSec,
                signal_wait_time_ms/ 1000.0 ASSignalSec,
                waiting_tasks_countASWaitCount
        FROM    sys.dm_os_wait_stats
        WHERE   wait_typeLIKE'WRITELOG%'
GO

/************************************
** Check for Log flush
************************************/
SELECT  'Implicit'ASTransaction_Type,
        SPID,
        Operation,
        COUNT(Operation)[OperationCount],
        [Transaction Name],
        COUNT([Transaction Name])AS[TransactionNameCount]
FROM    ::
        fn_dblog(NULL,NULL)
WHERE   operationLIKE'%LOP_BEGIN_XACT%'
        AND[SPID]=@@spid
        AND[SPID]ISNOTNULL
GROUPBYSPID,
        Operation,
        [Transaction Name]
     
GO

/********************************************************
** Compare the waittype collection
********************************************************/
SELECT  a.wait_type,
        'Explicit Transaction'ASTransaction_Type,
        (b.WaitSec-a.WaitSec)ASTotalwaitSec,
        (b.ResourceSec-a.ResourceSec)ASTotalResourceSec,
        (b.SignalSec-a.SignalSec)ASTotalSignalSec,
        (b.WaitCount-a.WaitCount)ASTotalWaitCount
FROM    (SELECT    *
          FROM      #wait
          WHERE     waitrun='w1'
        )a
        JOIN(SELECT   *
               FROM     #wait
               WHERE    waitrun='w2'
             )bONa.wait_type=b.wait_type
UNIONALL
SELECT  a.wait_type,
        'Implicit Transaction'ASTransaction_Type,
        (b.WaitSec-a.WaitSec)ASTotalwaitSec,
        (b.ResourceSec-a.ResourceSec)ASTotalResourceSec,
        (b.SignalSec-a.SignalSec)ASTotalSignalSec,
        (b.WaitCount-a.WaitCount)ASTotalWaitCount
FROM    (SELECT    *
          FROM      #wait
          WHERE     waitrun='w2'
        )a
        JOIN(SELECT   *
               FROM     #wait
               WHERE    waitrun='w3'
             )bONa.wait_type=b.wait_type

GO

Figure #2: implicit vs. explicit

Figure #2: implicit vs. explicit

Figure #3: implicit vs. explicit 

 
Analysis:
The analysis is simple and easy to understand from the output. From the above pictures we can see that the implicit transaction is always slow, signal wait is high and requires more I/O activities to complete a task.

Summary:
We saw that WRITELOG waittype does not necessarily indicate a disk throughput problem. It is the SQL Server Transaction Log management system who is doing more work to write each transaction into the log file. So before concluding, I would recommend to review your application code and see if you can use explicit transactions. I am sure that even though you use an Enterprise Class SSD system, implicit transaction may not improve the application performance dramatically.

MAXDOP - What triggers Parallelism?

$
0
0
Charles Darwin was an English naturalist. He established that all species of life have descended over time from common ancestors and proposed the scientific theory that this branching pattern of evolution resulted from a process that he called natural selection. I am sure that everybody knows this theory and it is well accepted.

How does the above analogy works with SQL Server Query Optimizer? Query Optimizer of SQL Server obeys Charles Darwin theory while creating an execution plan before executing the SQL Query. SQL Server query optimizer is a cost based optimizer, what it means is that before creating an execution plan it considers a number of facts and factors to produce a trivial and “good enough” plan. In the following short list, we can identify those:

1.      Construction of the query.
2.      Number of records, data length, and size of the table.
3.      Appropriate indexes and up-to-date statistics.
4.      I/O, CPU and Memory.

MAXDOP in OLTP:
In an OLTP environment, it is expectable that all queries and transactions are efficient and quick enough to finish its execution within 5 seconds. If it does not then SQL Server will take advantage of parallelism based on the query cost and MAXDOP setting.

There are a vast number of considerations, recommendations and concerns as well as what will be the settings of MAXDOP in OLTP environment? In OLTP implementation, it is expected that all queries have been written with performance in mind while adhering to the best practices. But in the real world this is not the case. Some queries are written poorly or are performing poorly because of the lack of appropriate indexes, out dated statistics, memory pressure, CPU bottleneck, slow I/O response, and so on.  

How MAXDOP works?
MAXDOP is the maximum number of worker threads SQL Server Query Optimizer can use to execute a query. Each thread will go to each processor’s core during an execution of a parallel query. The MAXDOP = 0 (zero) means that the Query Optimizer is flexible to use the required number of threads to execute the query based on a set of predefined rules and a mechanism built-in in SQL Server.  

Besides the server wide settings, Query hint (OPTION (MAXDOP n)) can be used to control parallel execution of a query. “Cost threshold for parallelism” is another server wide setting that can be utilized to control parallelism behavior. 

"At execution time, if parallel execution is warranted, the Database Engine determines the optimal number of threads and spreads the execution of the parallel plan across those threads in its each execution. When a query or index operation starts executing on multiple threads for parallel execution, the same number of threads is used until the operation is completed. The Database Engine re-examines the optimal number of thread decisions every time an execution plan is retrieved from the plan cache. For example, one execution of a query can result in the use of a serial plan, a later execution of the same query can result in a parallel plan using three threads, and a third execution can result in a parallel plan using four threads".

What triggers Parallelism?
There are a couple different and specific reasons in OLTP system that triggers SQL Server to choose parallel execution of query to speedup data retrieval process. The following are a couple of important key factors for which SQL Server database engine chooses parallel query execution. 

1.      The query contains ORDER BY or GROUP BY clause. This means excessive sort operation. There are no appropriate indexes to support the sort operation.
2.      Skewed data; meaning a column contains substantial number of duplicate records.
3.      Memory grant is in-sufficient to execute the query. All sort operation requires extra memory and thus causes a “spill to tempdb”.
4.      Not updated distribution statistics.
5.      Processing huge number of records.

Symptoms and detecting Parallelism Issue:
Usually CXPACKET waittype can be used to monitor parallel query execution behavior in OLTP systems. But keep in mind that CXPACKET does not necessarily indicate that parallelism is an issue. This wait means that the parent thread is waiting to synchronize all output from the child threads. However, if you see SQL blocking on CXPACKET, it indicates that the SQL Server is facing resource contention such as lack of indexes, out-dated statistics, I/O and CPU bottleneck, parameter sniffing issue, excessive sort operation and so on.

Generally and as per SSMS implementation, the combined waits from EXCHANGE, EXECSYNC and CXPACKET can be used to measure and identify whether parallelism is an issue or not.  

By increasing MAXDOP, if you see that the CPU usages goes high and the number of waiting tasks increases, this generally indicates that there is a parallelism issue. “Avg waiting tasks” in “Activity Monitor” can be used to observe the behavior quickly. Following simple queries are also good to observe the parallel threading behavior

SELECT  SUM(s.runnable_tasks_count)
FROM    sys.dm_os_schedulerss
WHERE   s.[scheduler_id]< 255

SELECT  wait_type,
        waiting_tasks_count,
        (wait_time_ms-signal_wait_time_ms)ASresource_wait_time_ms
FROM    sys.dm_os_wait_stats
WHERE   wait_typeIN('EXCHANGE','EXECSYNC','CXPACKET')
ORDERBYresource_wait_time_msDESC

You can also use my simple monitoring tool to detect and visualize parallelism issues. Please note that the excerpted scripts from SSMS were used to build this section.


Recommendations:
In OLTP systems using MAXDOP, value 1 is recommended by Microsoft and all the industry experts. However some queries will be benefited from higher value if you are not able to tune your queries, unable to create/update appropriate indexes or statistics. If you notice a fewer number of “Worker Threads” then MAXDOP =1 is more suitable and based on the workload it can be increased slowly.  

Reference:
Degree of Parallelism
http://msdn.microsoft.com/en-us/library/ms188611(v=sql.105).aspx

Understanding and Controlling Parallel Query Processing in SQL Server
http://msdn.microsoft.com/en-us/library/gg415714.aspx

Performance issues from ORDER BY/GROUP BY - spills in tempdb

$
0
0
It is very common and expected to see a query containing ORDER BY or GROUP BY clause for displaying or grouping purposes. It is also common that developers use ORDER BY clause from a habit without considering its necessity. As a result, queries become slower overtime as the number of records increases.


The Last Supper - by Leonardo da Vinci
Grouping example in Art 
When a sort operation unable to acquire sufficient memory grant and it cannot be done in the memory and must happen in the tempdb. The heavier processing load inside the tempdb degrades overall SQL Server performance significantly. This situation is usually known as “spill to tempdb” or “spills in tempdb”. It is crucial to identify those sort warnings and avoid them whenever possible.

In my experience, I have seen ORDER BY/GROUP BY being used on a VARCHAR (8000) column while retrieving data; even unwisely used on a JOIN clause! Tweaking these queries is a bit tricky and most of the time it is impossible since the front-end application or business logic has already been built-in on this criterion. Creating an index on this column is not possible due to the 900 bytes restriction on an index key column.  So, other than crossing fingers, there is nothing much to do to resolve the performance issue immediately.  

Common Issues:
Following are some common issues that occur due to the misuse of ORDER BY/GROUP BY clause:
1.      Rapid tempdb data file growth.
2.      Increases disk I/O activities on tempdb and tempdb drive.
3.      Introduces lock contention and escalation.
4.      Increases memory grant for sort/hash operation.
5.      Introduces parallel query plan.

Detecting the Issue:
Detecting performance issues that arise from sort operation is quite simple and straight forward. Following are some tips to identify issues:
1.      Review the query and identify columns that are used on ORDER/GROUP clauses.
2.      Review the Execution plan and identify “sort” operators.
3.      Identify parallelism operators that perform the “distribute streams”, ”gather streams” and “repartition streams” in parallel execution plan.
4.      Use SQL Profiler Trace event “sort warnings”.
5.      Extended Event – “sort_warning”
6.      Use PerfMom or sys.dm_os_performance to track “worktables created/sec” and “workfiles created/sec”

To resolve the performance Issue:
To resolve performance issues that occur from a sort operation, a couple of actions can be taken as follows:
1.        Review the necessity of a sort operation in the query.
2.        Try to perform a sort operation in the front-end.
3.        Normalize the database schema.
4.        Create single or multi-column indexes.
5.        Apply filters on indexes.
6.        Use TOP (n) when there is an “ORDER BY”, if possible.
7.        Put more filters in the query to touch less data.
8.        Update distribution statistics.

Observing the behavior:
To observe the common issues with ORDER BY/GROUP BY operations, let’s create a database, table and a simple select statement against 500,000 records.

CREATEDATABASEtestDB
GO
USEtestDB
GO

SETNOCOUNTON

IFOBJECT_ID('tblLarge')ISNOTNULL
    DROPTABLEtblLarge
GO

CREATETABLEtblLarge
    (
      xIDINTIDENTITY(1, 1),
      sName1VARCHAR(100),
      sName2VARCHAR(1000),
      sName3VARCHAR(400),
      sIdentifierCHAR(100),
      dDOBDATETIMENULL,
      nWageNUMERIC(20, 2),
      sLicenseVARCHAR(25)
    )
GO

/*********************************
Add 500000 records
**********************************/

SETNOCOUNTON
INSERT  INTOtblLarge
        (sName1,
          sName2,
          sName3,
          sIdentifier,
          dDOB,
          nWage,
          sLicense
        )
VALUES  (LEFT(CAST(NEWID()ASVARCHAR(36)),RAND()* 50),    -- sName1
          LEFT(CAST(NEWID()ASVARCHAR(36)),RAND()* 60),    -- sName2
          LEFT(CAST(NEWID()ASVARCHAR(36)),RAND()* 70),    -- sName2
          LEFT(CAST(NEWID()ASVARCHAR(36)), 2),              -- sIdentifier    
          DATEADD(dd,-RAND()* 20000,GETDATE()),            -- dDOB
          (RAND()* 1000 ),                                  -- nWage
          SUBSTRING(CAST(NEWID()ASVARCHAR(36)), 6, 7)        -- sLicense       
        )
GO 500000

/******************************************************
** Create a clustered index
******************************************************/
ALTERTABLE[tblLarge]
       ADD  CONSTRAINT[PK_tblLarge]
       PRIMARYKEYCLUSTERED ([xID]ASC)

/***************************************************************
** To resolve the sort warning, create a non-clustered index
***************************************************************/
CREATENONCLUSTEREDINDEX[IX_sName1]
       ON[tblLarge]([sName1]ASC)


Simple SELECT Statement:
Following are some simple select statements to reproduce the behavior.

/******************************************************
** Simple select statement
******************************************************/
--First query
SELECT  xID,
        sName1
FROM    tblLarge

-- Second query with - ORDER BY
SELECT  xID,
        sName1
FROM    tblLarge
ORDERBYsName1

-- Third query - GROUP BY/ORDER BY
SELECT  sName1,
        COUNT(sName1)ASnCount
FROM    tblLargea
GROUPBYsName1
ORDERBYsName1

Using Extended Events (SQL 2012), SQL Profiler Trace and Execution Plan, “sort warning” are easily detectable and following are some outputs.

Figure#1: sort warning using Extended Events in SQL 2012


Figure#2A: sort warning detection using Execution Plan


Figure#2B: sort warning detection using Execution Plan

  
Figure#2: sort warning detection using SQL Profiler Trace


Learn More:

Execution Plan and “SQL Sentry Plan Explorer” – it's like a hand of god!

$
0
0
There are numerous articles that have been written on how out-dated statistics cause severe performance issues. I am hesitant to add one more to that long list. However, this time I’ll be using “SQL Sentry Plan Explorer” to present the issue. Please note that I am not a sales agent or representative of “SQL Sentry”, I wanted to share its simplistic interface and usability. This tool is free, extremely powerful and it brings all the qualities a SQL Server Expert ever needs to analyze an Execution Plan; especially the ones who work on query performance tuning.

Sometime ago, I received a request from a source to help them out on a query performance issue. The issue they were experiencing was that the duration of a business critical query is degrading; and now it takes up to 5 minutes to complete!

I asked them to send me the XML output of the actual execution plan for that query. I opened the received query plan in both “SQL Sentry Plan Explorer” and “SSMS”; and found the root cause almost immediately – which was cardinality estimation issue due to “out-dated statistics”. So the ultimate recommendation was to update statistics. After updating, the query took less than 4 seconds.

Here, I am sharing the outputs from “SQL Sentry Plan Explorer” to show you how intuitive the tool is to understand an execution plan and identify any plan quality problems immediately. Following are a couple of screenshots you may find interesting.

Visit: SQL Sentry Plan Explorer

Some Screenshots:


Viewing all 94 articles
Browse latest View live