Quantcast
Channel: SQL Server – performance and other stories
Viewing all 94 articles
Browse latest View live

SQL I/O Latency and Disk Issue – The missing link

$
0
0
Say for example the application has been written with performance in mind, all queries are optimal, no index issues, databases are fully optimized through a nightly job or manually, and the best I/O subsystem has been deployed to achieve excellent I/O throughput. 

Log, Data, Indexes, tempdb are placed in RAID10, and all the best practices around the SQL Server were put in place. Yet the disk response time is not satisfactory. SQL Server DMV (sys.dm_io_virtual_file_stats, sys.dm_io_pending_io_requests, sys.dm_os_wait_stats) continuously reports I/O stalls or issues during peak hour. Performance counters such as Avg. Disk sec/Read, Avg. Disk sec/Write and Avg. Disk sec/Transfer exceed the accepted threshold (usually read/write > 20 milliseconds and transfer > 15 milliseconds) alarmingly for a long duration of time. Wait Type reports numerous "PAGEIOLATCH_*" significantly.

This is one of the “pulling hair” type situations to figure out the root causes. This article is for DBAs and Sys Admins who are running SQL Server in physical or in a virtual environment and experiencing slow I/O response.

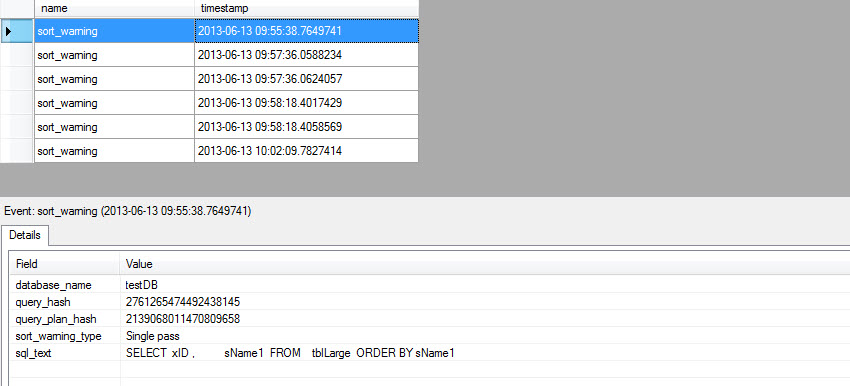
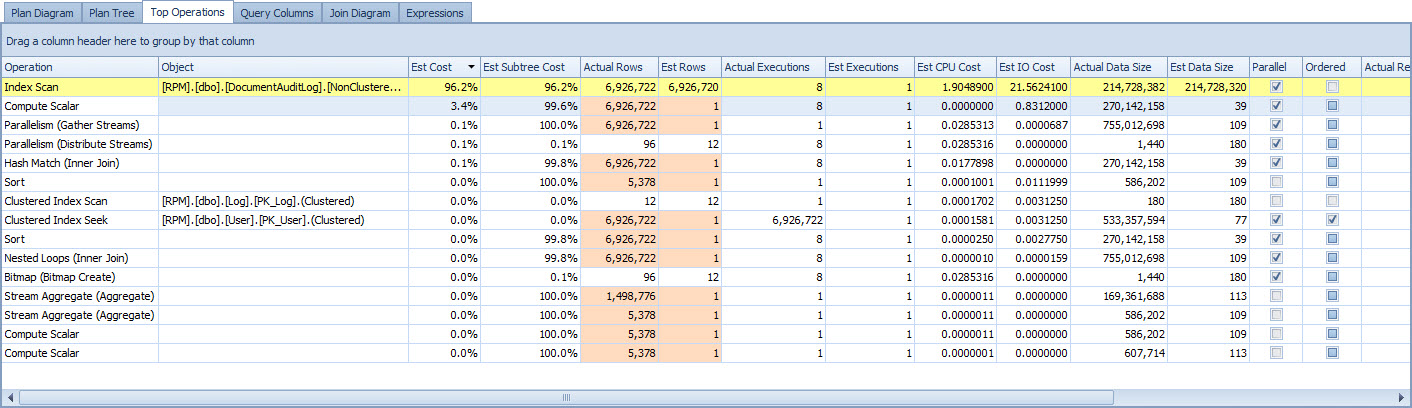
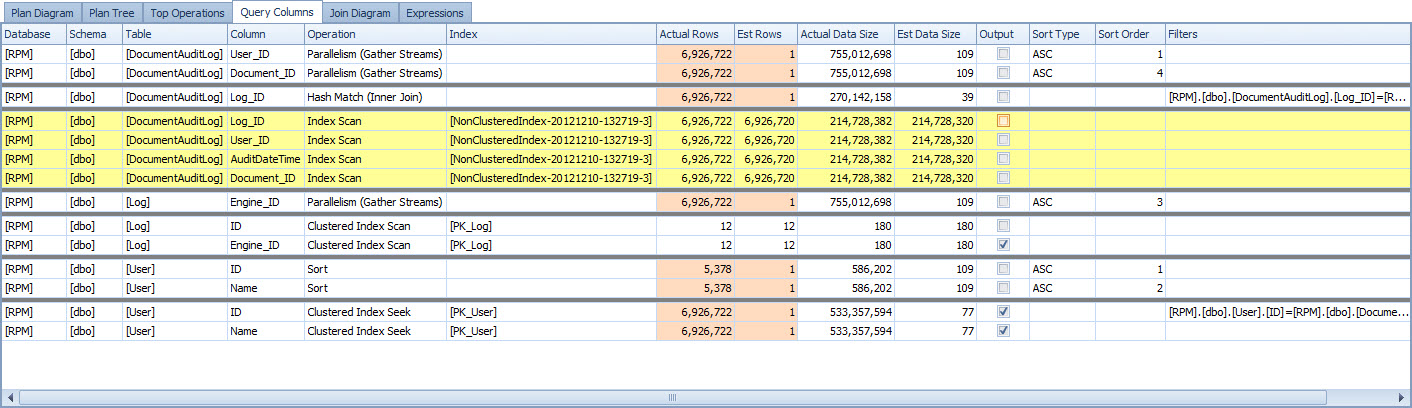
Detecting I/O Issues with SQL DMV:
To check for outstanding IOPs waiting longer than 10ms:
SELECT  *
FROM    sys.dm_io_pending_io_requests
WHERE   io_type='disk'
        ANDio_pending_ms_ticks> 10

To check the time spent waiting on PAGEIOLATCH_*:
SELECT  SUM(wait_time_ms)total_wait_ms
FROM    sys.dm_os_wait_stats
WHERE   wait_typeLIKE'PAGEIOLATCH%'

What to check?
There are some areas that need to be checked to see whether there is a misconfiguration or not.
1.       NTFS Allocation Unit (formerly known as cluster size)
2.       Volume Alignment (also known as disk, partition or sector alignment)
3.       HBA Disk Queue Depth


HBA Disk Queue Depth:
HBA Disk Queue Depth is another area which is often/always left as default (ranging from 8 to 32). This setting also needs to be reviewed based on workload. Inappropriate settings can significantly impact I/O throughput and out-of-the box values can be insufficient for SQL Server.


Although a testing is required to determine optimal value of HBA Disk Queue Depth for a particular workload; however queues depth of 64 is generally accepted as a good starting point in the absence of any specific vendor recommendations.

NTFS File allocation unit size (cluster size):
Often, the file allocation unit size (cluster size) is not taken into consideration while formatting a SQL Data drive (physical and virtual). It is highly recommended that all SQL Server data drives should be 64KB. "The best practice for SQL Server is to choose 64KB, because this reduces the likelihood of I/O’s that span distinct NTFS allocations, which then might result in split I/O’s." Eventually this introduces significant disk latency.

In SQL Server, each page size is 8KB, and eight (8) physically contiguous pages (8KB X 8 = 64KB) create one Extent. Therefore if the NTFS allocation unit size is 64KB then the Extent creation by SQL Server Engine will be hassle free, meaning it does not require extra pointer calculations overhead -which provides an efficient read and write operation.Use the following command to check drive info.

fsutil fsinfo ntfsinfo [your drive]

How to check Allocation Unit Size?
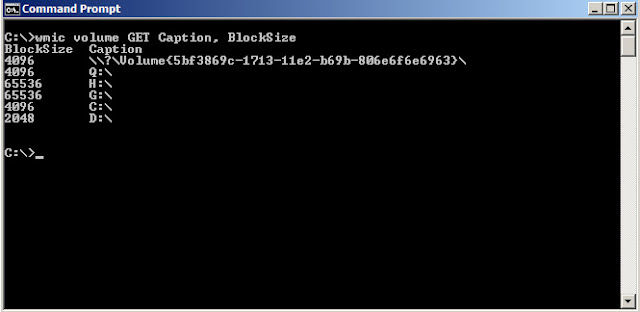
We can use the following command to check the "allocation unit size" of all logical disks. Open the command window and then type,

cmd> wmic volume GET Caption, BlockSize

The above command will provide the following output:

Volume Alignment (Disk Alignment, Sector Alignment or Partition Alignment):
From my experience, I have seen a number of DBAs, sysadmins and storage admins that have no idea what it is all about and what the impact is on the performance.In SQL Server OLTP environment (the DML operation such as SELECT, UPDATE) proper disk alignment will provide up to a 30% -40% dramatic performance improvement. This is clearly documented and explained in various Microsoft articles.

There are a number of sites where this topic has been discussed very elaborately. I encourage you to read those before preparing a disk for SQL Server data files.

Up to Windows 2003, Sector Alignment was not done automatically while formatting and installing Windows OS, it was all manual task which was usually performed by the server admin. This has been changed starting from Windows 2008 Server and later versions. Windows Server 2008 uses 1024 KB (2048 sectors) as a starting offset for the disk which is larger than 4GB, which will usually work well for almost any array.

How to check Volume Alignment?
There are many different methods and as well as tools are available to check volume alignment. Following is the simplest method:

1.       Type Msinfo32.exe in the search window in start menu.
2.       In the dialog box look for Components > Storage > Disks.
3.       Look for the desired logical drive and find the "Partition Starting Offset".
4.       The number is divisible by 4096 bytes -
(a)    If dividing it by 4096 reveals a whole number then volume alignment is correct.
(b)   If dividing it by 4096 gives decimal then the volume alignment is not correct.

Alternatively following command can used to get the same information.
cmd> wmic partition get Index, Name, StartingOffset


Manually adjust alignment for basic disks: 
We can use diskpart.exe to format the drive with correct alignment while preparing the Disk for SQL Server data files. Please be careful, following steps erase the selected partition- so don’t try it in a live system.

1.       Open a command prompt, then type diskpart
2.       Type list disk to check which disks are available
3.       Select the desired partition to align:
select disk <DiskNumber>
4.       We will Align the partition to 1024KB:
create partition primary align=1024
5.       Assign a drive letter to it:
assign letter=<DriveLetter>
6.       The volume alignment has set correctly. Now we can format the disk as usual.

Following is a demonstration to show you how to use above diskpart commands to correct volume alignment.


Following is freeware tool (Disk Alignment Test v1.0.1) can also be used to check disk alignment.


Recommendations:
1.       When formatting the partition that will be used for SQL Server data files, it is recommended that you use a 64-KB allocation unit size for data, logs, and tempdb.
2.       Review and align the sector to 1024KB (or 2048KB max) before formatting the disk
3.       Correcting the Allocation Unit Size and Volume Alignment is necessary for Physical and virtual disks for significant I/O performance.

Further Reading:
Disk Partition Alignment Best Practices for SQL Server

Performance Tuning Guidelines for Windows Server 2008

Recommendations for Aligning VMFS Partitions

Disk performance may be slower than expected when you use multiple disks in Windows Server 2003, in Windows XP, and in Windows 2000

Disk Alignment Test

Covering Index – A “Adam and Eve” Style

$
0
0
We know that in SQL Server there is a limitation on index key which is 900 bytes. This means that the total length of an index must not exceed 900 bytes. Until SQL 2000, we used to create a covering index by concatenating a number of columns to support a query execution. Starting from SQL Server 2005, Microsoft has added a new feature which is known as the “INCLUDE” column index.

In this article we will be researching on covering indexes, its performance comparison, which is between “multiple-columns index” (also known as composite, or concatenated) and “single column index” with the “include” option.

Covering index:
In a simple way, a covering index is one which can satisfy all requested columns in a query without performing a further lookup into the base table (clustered or heap). So, we can say a covering index is an index which will satisfy JOIN and WHERE clause as well as all the columns from the SELECT statement.

Example of covering index:
Say we have the following SELECT query from a table “tblLarge”,

SELECT  xID,              -- Primary and Clustered key
        sName1,           -- Key column for search
        sName2,           -- non-key column
        sName3,           -- non-key column
        sIdentifier       -- key column for search
FROMtblLarge

Based on the above select criteria, we may have the following covering indexes:

(a)    Multiple-column index without include option:
sIdentifier +  sName1 + sName2 + sName3
(b)   Multiple-column index with include option:
sIdentifier +  sName1  INCLUDE ( sName2 , sName3)

Please keep in mind that the clustered key does not need be part of the index.

Index Advantages:
The biggest advantage of a covering index is that it completely offloads the locking overheads from a table to the index. This reduces

1.        I/O operation
2.       Row lookup
3.       CPU usage

The overall benefit is a dramatic improvement of query response time.

Some Terms:
Let’s learn what we mean by Key and non-key column. Usually, a column said to be a key column is used on a JOIN or on a WHERE clause. The columns which are not used in search or in join clause are known as non-key columns.

A fact:
It is recommended that an index key should be narrow as possible- this means that Query Optimizer of SQL Server will always try to utilize the smallest index. SQL Server Query optimize is very picky because it is a cost based optimizer.

While creating an execution plan, Query Optimizer evaluates mainly two things; Selectivity and data retrieval cost. Based on the estimated cost of an index, it may not be selective enough so an index may not be used or if it selects a sub-optimal index, then query performance may hinder rather than improvement. In that case Index Hints can be used to force SQL Server to use a particular index.

Our Testing Approach:
1.       We will use a database called “TestDB”.
2.       A table “tblLarge” with 2,000,000 records.
3.       A clustered index on the Primary key “xID”.
4.       We will create two indexes.
5.       Buffer cache will be cleared before query execution.
6.       We will also collect STATISTICS IO output.

Sample Database, Table and Rows creation:
1.       Create a database “TestDB”

CREATEDATABASETestDB
GO
USETestDB
GO
2.        Create a “tblLarge” with default fill factor (which is 0 or 100)

SETNOCOUNTON
IFOBJECT_ID('tblLarge') IS NOT NULL
    DROPTABLEtblLarge
GO

CREATETABLE[tblLarge](
       [xID][int]IDENTITY(1,1)NOTNULL,
       [sName1][varchar](100)NULL,
       [sName2][varchar](200)NULL,
       [sName3][varchar](300)NULL,
       [sIdentifier][char](10)NULL,
       [dDOB][datetime]NULL,
       [nWage][numeric](20, 2)NULL,
       [sLicense][varchar](25)NULL,
 CONSTRAINT[PK_tblLarge]PRIMARYKEYCLUSTERED([xID]ASC) )

3.       Populate 2,000,000 rows.

SETNOCOUNTON
INSERT  INTOtblLarge
        (sName1,
          sName2,
          sName3,
          sIdentifier,
          dDOB,
          nWage,
          sLicense
        )
VALUES  (LEFT(CAST(NEWID()ASVARCHAR(36)),RAND()*50),     -- sName1
          LEFT(CAST(NEWID()ASVARCHAR(36)),RAND()*60),     -- sName2
          LEFT(CAST(NEWID()ASVARCHAR(36)),RAND()*70),     -- sName2
          LEFT(CAST(NEWID()ASVARCHAR(36)), 2),             -- sIdentifier      
          DATEADD(dd,-RAND()* 20000,GETDATE()),           -- dDOB
          (RAND()* 1000 ),                                 -- nWage
          SUBSTRING(CAST(NEWID()ASVARCHAR(36)), 6, 7)      -- sLicense
         )

GO 2000000

Sample SELECT query:
We will be using the following SELECT query to perform our test.

DBCCDROPCLEANBUFFERS
SETSTATISTICSIOON

SELECT  xID,              -- Primary and Clustered key
        sName1,           -- Key column for search
        sName2,           -- non-key column
        sIdentifier        -- key column for search
FROM    tblLarge
WHERE   sIdentifier='AB'
        ANDsName1LIKE'ABC%'

Any search string can be used to run the above query.

Covering Index with “INCLUDE” option:
In our first test, let’s create two covering indexes with the “INCLUDE” option as follows.

Ind#1
CREATEINDEX[IX_sIdentifier]ON[tblLarge]([sIdentifier])
INCLUDE ([sName1], [sName2])

Once the index#1 is created, we run the above query, and it provides the following Execution Plan.
Let’s create a variation of the above index and move the “sName1” column to the index key as follows.

Ind#2
CREATEINDEX[IX_sIdentifier_sName1]ON[tblLarge]([sIdentifier],[sName1])
INCLUDE ([sName2])

When we run the query, we get the following Execution Plan.


Covering Index without “INCLUDE” option:
In our second test, we will create a multiple-column index without the “INCLUDE” option as follows.

Ind#3
CREATEINDEX[IX_sIdent_sName1_sName2]ON[tblLarge]([sIdentifier],[sName1],[sName2])

Now if we run our query, it will result in the following Execution Plan.
STATISTICS IO Comparison:
When  #X Index
Scan Count
Read-Ahead Reads
Physical Reads
Logical Reads
Ind#1
1
72
2
75
Ind#2
1
0
0
3
Ind#3
1
0
0
4


Index Properties of each Index:


Review of Query execution:

1.       When we first created the index “ind#1”, query utilized this index although the index is not completely covered. When the query was first executed, there were no statistics for the column “sName1”, so SQL Server created missing statistics.
2.       In case of “ind#2”, all the predicates are found in this index and as well “sName2” which is included with the “INCLUDE” option. So this index has totally covered the query.
3.       For the “ind#3”, we created this index at the end without deleting the previous two indexes. Though the second index is far better than the third index, SQL Server started using this multiple-column index although it is a little expensive.

As an explanation, when we create multiple-column indexes, a multi-column statistics is also created along with the index which provides better cardinality estimations to evaluate the query. However, if we examine the properties of all the indexes, then you will notice that the depth of “ind#3” is 4, which makes it more complex in nature by adding one more leaf level in the b-tree structure.

Summary:
There is a saying which goes like “Query writing is an Art, index is a Science”. As SQL Server uses indexes, it does not mean that it is efficient too. Reviewing the "Index Depth" is one of the critical factors for a performance boost while creating a covering index for a query.
While creating indexes, we should not forget that there is a cost and penalty to maintain indexes where DML operation happens very frequently, and which often reduces the benefit of having indexes. Also we should not have duplicate and overlapping indexes, unless there is a very specific reason.

Read More:
SQL Server Optimization

Increase fan-out to reduce index depth

Clustered and Nonclustered Indexes Described

Introduction to Indexes

TCP Chimney Offloads and SQL Server Implementation

$
0
0
A lot of us often see the following type of sporadic messages although everything is running as usual. After the application or user receives the network related messages, there will be some trouble occurring with the system however it will behave normally again after each event.


What Is the Mystery
Behind the Mona Lisa?
Some logged messages can be found in SQL Server Error Log and Windows Event logs, some can be popped up within the application and others can be detected by querying the SQL Server Extended Event.

Some observed Error Messages:
[Microsoft][ODBC SQL Server Driver][DBNETLIB] General Network error. Check your network documentation.

ERROR [08S01] [Microsoft][SQL NativeClient]Communication link failure

System.Data.SqlClient.SqlException: A transport-level error has occurred when sending the request to the server. (provider: TCP Provider, error: 0 - An existing connection was forcibly closed by the remote host.)

Network error 0x40 occurred while sending data to the client on process ID XX batch ID 0. A common cause for this error is if the client disconnected without reading the entire response from the server. This connection will be terminated.


A fatal error occurred while reading the input stream from the network. The session will be terminated (input error: XXX, output error: XXX).

Network error code 0x2746 occurred while establishing a connection; the connection has been closed. 

Possible Mystery Behind Network Latency:
There could be a number of reasons why this happens. Following are some of the potential areas where network latency and overheads can occur sporadically or continuously.

(A)    Implicit Transaction:
Implicit transaction mode generates a continuous chain of transactions which causes a delay to commit or rollback each transaction. This significantly degrades the performance and reduces concurrency in a high throughput OLTP system.

(B)    Network bandwidth bound application:
Database Mirroring, Always ON and Transitional Replication are usually Network bound application processes. Reading and writing large amounts of data or documenting continuously may increase latency and degrade network performance.

(C)     TCP Chimney offloads:
“TCP Chimney Offload transfers Transmission Control Protocol (TCP) traffic processing, such as packet segmentation and reassembly processing tasks, from a computer’s CPU to a network adapter that supports TCP Chimney Offload. Moving TCP/IP processing from the CPU to the network adapter can free the CPU to perform more application-level functions. TCP Chimney Offload can offload the processing for both TCP/IPv4 and TCP/IPv6 connections if supported by the network adapter”. Thus if this setting is incorrect on the both server OS and NIC level, then performance issues are guaranteed.

(D)    NIC Teaming:
"NIC teaming makes two or more physical NICs appear as a single virtual one to the application, which isolates application from failures of an individual NIC. There are two types of teaming:

1.    Switch independent (the switch does not know the NICs are teamed) and
2.    Switch dependent (the network switch participates in the teaming).

NIC teaming can also result in bandwidth aggregation such that, for example, four 1GB/Sec NICs can provide an aggregate 4GB/Sec throughput. In the event of problems, the teaming has to be disabled in order to verify it is not causing the problem."

(E)     Jumbo Frames:
Jumbo frames are only available on gigabit networks, and all devices in the network path must support them (switches, routers, NICs, and so on). If all the networking hardware doesn't support end-to-end Jumbo Frames they should not be used and should be disabled.

"Jumbo frames" extends Ethernet to 9000 bytes and is large enough to carry an 8 KB application datagram (e.g. NFS) plus packet header overhead. If Jumbo frames is supported on a Gigabit Network then “Network Packet Size” configuration in SQL Server can be increased to 8192 in a high throughput environment.

To check whether the jumbo frames is supported by the target machine, execute following command

ping <IP or server name> -f –l 9000

Figure:Jumbo frames support check

(E)     Maximum Transmission Unit (MTU):
The Maximum Transmission Unit (MTU) feature is an advanced configuration that allows determining the largest data size permitted on a network connection. Generally, if the MTU is too large for the connection, computer will experience packet loss or dropping connection.

To determine the correct MTU size for a network, we have to do a specific ping test on the destination (target server).For Windows environment, use the following command for the ping test:

Syntax: ping [server or IP address] –f –l xxxx
Example:ping 192.168.0.50 –f –l 1472

This test can start from 1472 until we can reach the exact packet size which will not result to the prompt “Packet needs to be fragmented but DF set.” You may adjust (decrease/increase) the value by 10.

Implicit Transaction and TCP Chimney offloads:
The DML centric application which mostly depends on implicit transactions of SQL Server generates a lot of LOG I/O which initiates further delay on log writing process and introduces network latency.  Turning of TCP Chimney offloads is one of the “first things to do” that can be considered in order to eliminate any possibilities in this area.

“TCP Chimney Offloads” functionality does not work with virtualized Windows OS (vmware and hyper-v), therefore it can be disabled permanently.


This is one of the potential overlooked areas by many sysadmin, which needs further investigation if the received error message looks similar to the issues which have been mentioned before in the article. Although it is not the best practice, it is still recommended by many Network Experts that the “TCP Chimney Offloads” setting must be disabled in both Windows OS and NIC level to reduce latency in SQL Server implementation whether it is virtual or physical.

Windows OS and TCP Chimney offloads:
In Windows 2003 - TCP Chimney Offload is enabled by default.
In Windows 2008 - TCP Chimney Offload is disabled by default.
In Windows 2008 R2 - TCP Chimney Offload is automatic by default.
In Windows 2012 -TCP Chimney Offload is disabled by default.

How to check TCP Chimney Offloads:
(a)    In Windows 2003 use the following command
netsh interface ip show offload
(b)   In Windows 2008 and above use the following command
netsh int tcp show global

Screenshot from Windows 2008 R2
Screenshot from Windows 2012


XE Events (Extended Events) Query:
/***************************************************************
** Errors reported along with the error counts
****************************************************************/

SETNOCOUNTON

-- Store the XML data in a temporary table
SELECT  CAST(xet.target_dataASXML)ASXMLDATA
INTO    #xeTmpTbl
FROM    sys.dm_xe_session_targetsxet
        JOINsys.dm_xe_sessionsxeON (xe.address=xet.event_session_address)
WHERE   xe.name='system_health'

-- Get statistical information about all the errors reported
;WITH    myXEinfo(EventXML)
          AS (SELECT   C.query('.')EventXML
               FROM     #xeTmpTbla
                        CROSSAPPLYa.XMLDATA.nodes('/RingBufferTarget/event')AST(C)
             ),
        myXEErrorInfo(EventTime,ErrorNum)
          AS (SELECT   EventXML.value('(/event/@timestamp)[1]','datetime')ASEventTime,
                        EventXML.value('(/event/data/value)[1]','int')ASErrorNum
               FROM     myXEinfo
               WHERE    EventXML.value('(/event/@name)[1]','varchar(255)')='error_reported'
             )
    SELECT  ErrorNum,
            MAX(EventTime)ASLastRecordedEvent,
            MIN(EventTime)ASFirstRecordedEvent,
            COUNT(*)ASOccurrences,
            b.[text]ASErrDescription
    FROM    myXEErrorInfoa
            INNERJOINsys.messagesbONa.ErrorNum=b.message_id
    WHERE   b.language_id=SERVERPROPERTY('LCID')
    GROUPBYa.ErrorNum,
            b.[text]

--  Get information about each of the errors reported
 ;
WITH    myXEinfo(EventXML)
          AS (SELECT   C.query('.')EventXML
               FROM     #xeTmpTbla
                        CROSSAPPLYa.XMLDATA.nodes('/RingBufferTarget/event')AST(C)
               WHERE    C.query('.').value('(/event/@name)[1]','varchar(255)')='error_reported'
             )
    SELECT  EventXML.value('(/event/@timestamp)[1]','datetime')ASEventTime,
            EventXML.value('(/event/data/value)[1]','int')ASErrNum,
            EventXML.value('(/event/data/value)[2]','int')ASErrSeverity,
            EventXML.value('(/event/data/value)[3]','int')ASErrState,
            EventXML.value('(/event/data/value)[5]','varchar(max)')ASErrText
            --EventXML.value('(/event/action/value)[2]', 'varchar(10)') AS Session_ID
    FROM    myXEinfo
    ORDERBYEventTimeDESC
--  Drop the temporary table
DROPTABLE#xeTmpTbl


/**************************************************************************
** Extract Ring Buffer Information for SQL Server 2008 instances and above
**************************************************************************/
SELECT  CONVERT(VARCHAR(30),GETDATE(), 121)ASrun_time,
        DATEADD(ms,(a.[record_time]-sys.ms_ticks),GETDATE())AS[notification_time],
        a.*,
        sys.ms_ticksAS[current_time]
FROM    (SELECT    x.value('(//Record/Error/ErrorCode)[1]','varchar(30)')AS[error_code],
                    x.value('(//Record/Error/CallingAPIName)[1]','varchar(255)')AS[calling_API_name],
                    x.value('(//Record/Error/APIName)[1]','varchar(255)')AS[API_name],
                    x.value('(//Record/Error/SPID)[1]','int')AS[SPID],
                    x.value('(//Record/@id)[1]','bigint')AS[record_id],
                    x.value('(//Record/@type)[1]','varchar(30)')AS[type],
                    x.value('(//Record/@time)[1]','bigint')AS[record_time]
          FROM      (SELECT    CAST(recordASXML)
                      FROM      sys.dm_os_ring_buffers
                      WHERE     ring_buffer_type='RING_BUFFER_SECURITY_ERROR'
                    )ASR(x)
        )a
        CROSSJOINsys.dm_os_sys_infosys
ORDERBYa.[record_time]ASC

Reference:
Using TCP Chimney Offload

Network Changes Affect Windows Server 2012

Information about the TCP Chimney Offload, Receive Side Scaling, and Network Direct Memory Access features in Windows Server 2008

Error message when an application connects to SQL Server on a server that is running Windows Server 2003: "General Network error,""Communication link failure," or "A transport-level error"

How to Disable TCP Chimney, TCPIP Offload Engine (TOE) or TCP Segmentation Offload (TSO).

TCP Chimney Offload – Possible Performance and Concurrency Impacts to SQL Server Workloads

DBCC CHECKDB – “After death comes the doctor”

$
0
0
It is a common practice for a lot of us to run DBCC CHECKDB before backing up the database. Doing so on a small database performance impact may be negligible. However, for a large and high-end OLTP system, impact is noticeable and significant.

The point is why do we run DBCC CHECKDB and what does it achieve? Generally DBCC CHECKDB is considered as a maintenance command to make sure that a database is in a consistent state. it can be used to repair a suspect or corrupt database with or without losing data. Losing a single byte of production data is not desirable and running DBCC CHECKDB isn’t the only way to make sure if the database is in good shape.

In this article we will be focusing on some other options and a easy to follow checklist which will help to prevent a possible database corruption.

What is database corruption?
When one or more pages cannot be read by the database engine, the database will be marked as Suspect or Restore pending. Generally there are two types of page corruptions that can happen– logical and physical.

(a)    Physical error: 823
A Windows read or write request has failed. In the read case, SQL Server will have already retried the read request four times. This error is often the result of a hardware error, but may be caused by the device driver. This is known as CRC (cyclic redundancy check) failure.
(b)   Logical error: 824
This error indicates that Windows reports that the page is successfully read from disk, but SQL Server has discovered something wrong with the page. This error is similar to error 823 except that Windows did not detect the error. This usually indicates a problem in the I/O subsystem, such as a failing disk drive, disk firmware problems, faulty device driver, and so on. This is known as torn page detection.
(c)    Restore Pending: 829
A page has been marked as restore pending.

Why do database corruptions happen?
SQL Server Engine highly cares about database corruption and although Microsoft put excellent and tremendous effort to protect user databases from every angle, database corruption still may happen due to the following identified reasons:

(a)    Faulty disk and controller system
(b)   Outdated bios firmware
(c)    Disk Caching issue
(d)   inappropriate system driver
(e)   Power supply failure

How to prevent database corruption:
There is no precise answer to this. Generally, database corruption happens due to faulty hardware and it is more or less random in nature. Therefore proactive monitoring of various logged events and taking action against suspicious occurrences is the key to prevent database corruption.

Starting from SQL 2005, there are features in Database Engine which reduces the likelihood of page level corruption, one is "Checksum" mechanism and another is "automatic pagerepair".

(a)    PAGE_VERIFY  CHECKSUM (SQL 2005, and up): This is a per database setting.  When CHECKSUM is enabled for the PAGE_VERIFY database option, the SQL Server Database Engine calculates a checksum over the contents of the whole page, and stores the value in the page header when a page is written to disk. When the page is read from disk, the checksum is recomputed and compared to the checksum value that is stored in the page header.

However, there is a glitch about this mechanism - the checksum are computed on the pages that are written only after the database has been enabled for checksum and re-computed when such pages are read back. Since the database was not initially created with checksum enabled, there will be pages in the database that have no checksums.

(b)   Database Mirroring (SQL 2005 SP1, and up): Automatic page repair, this feature is based on the fact that the principal and mirror databases are exactly the same. So, if a page becomes corrupt on the principal, SQL Server should be able to read the page from the mirror and use it to fix the principal. Similarly, if a page becomes corrupt on the mirror, the page can be read from the principal to fix the mirror.

(c)    AlwaysON (SQL 2012): Automatic page repair is supported by AlwaysON Availability Groups. After certain types of errors corrupt a page, making it unreadable, an availability replica (primary or secondary) attempts to automatically recover the page. The partner/replica that cannot read the page requests a fresh copy of the page from its partner or from another replica. If this request succeeds, the unreadable page is replaced by the readable copy, and this usually resolves the error.

Performance Impact:
Running DBCC CHECKDB against large database will incur significant performance impact. DBCC CHECKDB statement typically must read each allocated page from disk into memory so that it can be checked. By design this command will check allocation and structural integrity of all tables, indexes, indexed views and as well as text and image objects. Below are three major impacted areas.

(a)    Significant memory usage
(b)   Extensive I/O activities
(c)    Heavy spooling to tempdb

DBCC CHECKDB does not create any blocking and it works on a snapshot taken internally. Please note that executing DBCC CHECKDB automatically executes DBCC CHECKTABLE for each table in the database, as well as DBCC CHECKALLOC and DBCC CHECKCATALOG, eliminating the need to run them separately.

What to monitor?
Along with others routine checks, we should include the following areas in order to understand the system and database health.

(a)    SQL Server ERROR LOG for ERROR 823, 824
(b)   Windows System Events (disk, iSCSI, ftdisk, etc)
(c)    Querying msdb for possible events: SELECT*FROMmsdb..suspect_pages
(d)   AlwaysON Availability Groups: SELECT*FROMsys.dm_hadr_auto_page_repair
(e)   Database mirroring: SELECT*FROMsys.dm_db_mirroring_auto_page_repair

Last ran of DBCC CHECKDB against all databases:
/***********************************************************
** Last ran of DBCC CHECKDB against all databases
***********************************************************/
SETTRANSACTIONISOLATIONLEVELREADUNCOMMITTED
SETNOCOUNTON

DECLARE@databasesTABLE
        (
          IdINTIDENTITY(1, 1)
                 PRIMARYKEY,
          ParentObjectVARCHAR(255),
          ObjectVARCHAR(255),
          FieldVARCHAR(255),
          ValueVARCHAR(255)
        )

INSERT  INTO@databases
        (ParentObject,
          Object,
          Field,
          Value
        )
        EXECsp_msforeachdbN'DBCC DBINFO(''?'') WITH TABLERESULTS;';

INSERT  INTO@databases
        (ParentObject,
          Object,
          Field,
          Value
        )

        SELECT  'Final Record',
                'Final Record',
                'dbi_dbname',
                'Final Record';

WITH    database_name(Id,Field,Value,DBID)
          AS (SELECT   Id,
                        Field,
                        Value,
                        ROW_NUMBER()OVER (PARTITIONBYFieldORDERBYID)
               FROM     @databases
               WHERE    Field='dbi_dbname'
             ),
        Last_DBCC_CHECKDB(Id,Field,Value)
          AS (SELECT   Id,
                        Field,
                        Value
               FROM     @databases
               WHERE    Field='dbi_dbccLastKnownGood'
             )

     SELECTDISTINCT
            db1.Value[database_name],
            ldc.Value[last_DBCC_CHECKDB]
     FROM   Last_DBCC_CHECKDBldc
            INNERJOINdatabase_namedb1ONldc.Id>db1.Id
            INNERJOINdatabase_namedb2ONldc.Id<db2.Id
                                            ANDdb2.DBID=db1.DBID+ 1
     ORDERBYdb1.Value;

Automated Monitoring and SQL Alert Feature:
DBCC CHEKDB is a more reactive and corrective kind of command which tells us the sad story of a database’s consistency after it corrupted. It will be too late to take action when the corruption is discovered. 

In order to get early notifications regarding database issues, we can easily implement a notification service task which will let us know immediately when an issue occurred in a database.

How to enable Alert System: 
1.       Configure Database Mail and Create a mail profile
2.       Create operator who will be notified in the event of issue
3.       In SQL Server Agent attach the mail profile to the Alert System
4.        SQL Agent Server needs to be restarted to take effect of above changes
5.       Expand SQL Agent tree nodes and choose Alert and create New Alert
6.       In the Alert Dialog box – choose “SQL Server Event Alert”
7.       For “Severity” level there are couples of options, select “Fatal” type such as 023, 024, 025, etc.

Below is a Notification Configuration screenshot for alerting a database corruption error in SQL Server Instance level for all databases.


We will receive the following alert message in case of any integrity issue.

DESCRIPTION:   SQL Server detected a logical consistency-based I/O error: incorrect checksum (expected: 0x94a8f51f; actual: 0x0275a963). It occurred during a read of page (1:0) in database ID 7 at offset 0000000000000000 in file 'C:\Temp\TestDB.mdf'.  Additional messages in the SQL Server error log or system event log may provide more detail. This is a severe error condition that threatens database integrity and must be corrected immediately. Complete a full database consistency check (DBCC CHECKDB). This error can be caused by many factors; for more information, see SQL Server Books Online.

Database Corruption related message can be found in SQL Server ERROR LOG:

2013-04-02 11:30:15.920 spid57 Setting database option ONLINE to ON for database 'TestDB'.
2013-04-02 11:30:15.920 spid57 Starting up database 'TestDB'.
2013-04-02 11:30:15.940 spid57 Error: 824, Severity: 24, State: 6.
2013-04-02 11:30:15.940 spid57 SQL Server detected a logical consistency-based I/O error: incorrect checksum (expected: 0x94a8f51f; actual: 0x0275a963). It occurred during a read of page (1:0) in database ID 7 at offset 0000000000000000 in file 'C:\Temp\TestDB.mdf'. Additional messages


Result of querying msdb for all possible recorded events happened in SQL Server instance level:

 
Recommendations:
Preventing database corruptions are one of the critical tasks of any DBA’s or SysAdmin’s job responsibilities. Along with the regular database backups and system checks described above, Automatic Page Repair features of database mirroring or AlwaysON can be used to prevent page level corruption.

Summary:
Honestly, no matter whatever we do, regular database and frequent transaction log backup is the only safeguard against database corruption or any disastrous situation. And even though, if the backup has not been restored successfully somewhere and periodically, nobody can guarantee that the backup is good enough to restore the database– we are not prepared for a database disaster.

So “After corruption comes the DBCC CHECKDB” is similar to “After death comes the Doctor”.

Learn from Guru: 
SQL Server DBCC CHECKDB
http://www.sqlskills.com/blogs/paul/category/checkdb-from-every-angle/

Description of using disk drive caches with SQL Server that every database administrator should know

SQL Server 2012 AlwaysON: "Automatic Page Repair" - how does it work?

$
0
0
SQL Server 2012 brought us a new HADR (high availability disaster recovery) feature and declares that database mirroring will be deprecated in future versions. Like database mirroring, AlwaysON has a similar feature: “Automatic Page Repair”. In the “AlwaysON Availability Groups”, if a participating database in any replica became a victim of page level issue (logical consistency) then that page will be automatically repaired by a non- affected page from another replica. A background service does this repair task once SQL Server Database Engine encounters an error similar to SQL Server detected a logical consistency-based I/O error.

In this article, we will be testing “Automatic Page Repair” functionality of SQL Server 2012 in the Windows 2012 environment. To test this feature we have the following:

1.       The entire environment is running inside VMware ESXi 5.0
2.       We have two Nodes Windows 2012 Datacenter Failover Cluster (WSFC)
3.       Two nodes SQL Server 2012 instance participating in WSFC.
4.       One is read-write "primary replica" and another is readable "secondary replica".
5.       Failover mode is “Automatic” and data synchronization mode is “synchronous”

In our testing, we will manually corrupt a primary read-write database to see how “Automatic Page Repair” functionality helps us to recover our database. To corrupt our test database we will be using a HexEditor XVI32 which can be downloaded from http://www.chmaas.handshake.de/.

A brief about our AlwaysON:

1.         ”BlogHAGroup” is the AlwaysON Availability Groups.
2.         SQL12K1 is the primary replica.
3.         Our “TestDB” is the only database participating in AlwaysON Availability Groups and resides in SQL12K1.
4.         SQL12K2 is the secondary replica and where the “TestDB” is read only.

Screenshots of our AlwaysON Setup:


Windows 2012 Failover Cluser with AlwaysON Availability Groups:

AlwaysON Availability Groups in SSMS 2012:


Let’s Get Started:

1.       Let’s create a table “Country” in the primary replica and insert some data into this table.

CREATETABLE[Country]
    (
      [xID][int]IDENTITY(1, 1)
                  NOTNULL,
      [sCountry][varchar](50)NOTNULL,
      [sAbbrev][varchar](5)NOTNULL
    )

INSERT  INTOCountry
        (sCountry,sAbbrev)
VALUES  ('Canada','CA'),
        ('United States','US'),
        ('Afghanistan','AF'),
        ('Albania','AL'),
        ('Algeria','DZ'),
        ('Andorra','AD'),
        ('Angolia','AO')


2.       Query the primary and secondary replica. Both table schema and the data have been synchronized (figure #1).

3.       To simulate a database disaster and  to corrupt the database we need to do the following:
(a)    We stop SQL Server Service in SQL12K1. Please note that in AlwaysON mode, a participating database in an “availability group” can’t be offline.
(b)   Go to the database folder and provide the appropriate OS permission. And then use HexEditor to open the data file (figure #2).
(c)    Let’s search the string “Andorra” and on the left hand side, type any number and then save the changes.
(d)   Start SQL Server Service on SQL12K1 which is our primary read-write replica.

4.       Execute a SELECT statement on primary replica (SQL12K1) and we will receive the following error:

SQL Server detected a logical consistency-based I/O error: incorrect checksum (expected: 0x2f2c9f8a; actual: 0xb9b4fc2b). It occurred during a read of page (1:231) in database ID 5 at offset 0x000000001ce000 in file 'H:\HADB\TestDB.mdf'.  Additional messages in the SQL Server error log or system event log may provide more detail. This is a severe error condition that threatens database integrity and must be corrected immediately. Complete a full database consistency check (DBCC CHECKDB). This error can be caused by many factors; for more information, see SQL Server Books Online.

5.       Query the following table and DMV, and then we will see the following page related issue recorded in the table (figure #3).
     select*from msdb..suspect_pages
     select*fromsys.dm_hadr_auto_page_repair
 
6.       Wait for a few seconds to let the SQL Server Engine repair the corrupt page then execute the SELECT statement against “country” table again. The corrupted page has been rectified!

Figure # 1: Table and data


Figure # 2: Manually damaging a page with HexEditor

Figure # 3: Suspect pages
 
Summary:
As we saw the AlwaysON service is an excellent feature in SQL Server 2012 which provides maximum benefits for “High Availability” than ever before and “Automatic Page Repair” protects the database in instantly.

Non-clustered indexes per table – how many indexes are too many?

$
0
0

There is a strong recommendation that “Don’t create too many indexes, because it degrades performance due to overhead of DML operations”. Having indexes on a table is necessary and on the other hand it may have a tradeoff – performance gain versus overhead of maintaining. All indexes need optimization (rebuild, reorganize or statistics update) on a regular basis. So if the overall performance gain is worth more than the cost of maintaining indexes we receive from the queries that uses the index, then having indexes is fully justified.

MSDN Says “As with most performance optimization techniques, there are tradeoffs. For example, with more indexes, SELECT queries will potentially run faster. However, DML (INSERT, UPDATE, DELETE and MERGE) operations will slow down significantly because more indexes must be maintained with each operation. Therefore, if queries are mostly SELECT statements, more indexes can be helpful. If the application performs many DML operations, we should be conservative with the number of indexes we create.”

Non-clustered indexes per table:
Starting from SQL Server 2008, a table can have 999 non-clustered indexes where as in SQL Server 2005, a table can have 249 non-clustered indexes. So from SQL 2008 there is a significant enhancement done in Database Engine level. In SQL 2012, one more new feature has been added– columnstore index, though it is not useful in OLTP implementation (sorry folks columnstore index is read only).

Index column limitation:
(a)    An index key (length of all index columns) can’t exceed 900 bytes and there will be a maximum of 16 columns in an index key.
(b)   From SQL Server 2005, we can include non-key columns in a non-clustered index to avoid the limitation of a maximum of 16 key columns and 900 bytes limitation.
(c)    If the table contains one or more XML indexes, the clustering key of a table is limited to 15 columns because the XML column is added to the clustering key of the primary XML index.
(d)   LOB data type (image/Text) can’t be part of an index key.

Good practices while creating indexes:
Creating useful indexes is one of the most important ways to achieve better query performance. Thoughtful indexes help find data with fewer disk I/O operations, less CPU cycles, small memory footprint and less system resource usage. The following are a few good practices around indexes:

(a)    Create a separate file group for indexes and place the file in a faster disk such as RAID10.
(b)   Based on DML operation, adjust Fill Factor from 80 to 90 for example. Low Fill Factor value introduces memory pressure, extensive I/O operation while High Fill Factor value causes page split thus high fragmentation.
(c)    Multi-column indexes are very useful; it creates multi-column statistics, but watch for “Index Depth”, more than 3 of this value decreases search efficiency.
(d)   Never add the clustered key with a non-clustered index or with the INCLUDE option.
(e)   While creating multi-column indexes, keep most unique value columns (high selective) to the left and try not to create a wider column index.
(f)     Be very careful about duplicate indexes and drop it without any hesitation.
(g)    Overlapping indexes - try to consolidate multiple indexes into few such as one or two
(h)   Review index usage on a regular basis and adjust (or drop) non-optimal indexes.

Index Rebuild/Reorganize know-how: 
1.       Always use DROP_EXISING=ON while rebuilding/adjusting an existing index.
2.       Examine fragmentation overtime; and
If the “avg_fragmentation_in_percent” value derived from “sys.dm_db_index_physical_stats” then rebuild/reorganize as follows:
(a) 5% and < = 30% - ALTER INDEX REORGANIZE
(b) > 30% - ALTER INDEX REBUILD
3.       Indexes with less than128 extents (1,024 pages =8mb) may not be good candidates for index rebuild.
4.       Clustered index cannot rebuild ONLINE when the underlying table contains LOB data type.
5.       A non-clustered index can rebuild ONLINE if it does not contain columns of LOB data type even though the underlying table does.
6.       Reorganizing (REORGANIZE) an index is always executed online and lesser resources are used.
7.       Reorganize does not update statistics but only compacts the index pages.
8.       Rebuilding a unique or non-unique clustered index does not rebuild the non-clustered indexes.
9.       When ALL is specified, all indexes on the table are dropped and rebuilt in a single transaction.

Non-clustered indexes per Table impact:
In the following test we will be reviewing the impact of having a number of indexes in a table. We will be performing this test:

1.       On a Heap without any index.
2.       On a clustered index with couple of indexes.

We will use the following work flow to perform a simple test:

1.       We will run SQL Profiler Trace.
2.       Create a table (which is still a heap).
3.       Insert 10,000 records.
4.       DROP the table and recreate it with clustered index, create five non-clustered indexes.
5.       Compare the profiler and DMV output about duration, page split and fragmentation.

The above test can also be performed using Microsoft “OSTress.exe” by creating multiple concurrent connections by executing smaller DML statements to simulate production like behavior. Either way, the final results will be same.

DMV Query:

To check table and index level changes:
SELECT  OBJECT_NAME(ios.object_id,ios.database_id)astable_name,
              ios.index_id,
        si.nameASindex_name,
        ios.leaf_insert_count+
        ios.leaf_update_count+
        ios.leaf_delete_countASleaf_changes,
        ios.leaf_allocation_countASleaf_page_splits,
        ios.nonleaf_insert_count+
        ios.nonleaf_update_count+
        ios.nonleaf_delete_countASnonleaf_changes,
        ios.nonleaf_allocation_countASnonleaf_page_splits,
        (ios.range_scan_count+ios.leaf_insert_count
            +ios.leaf_delete_count+ios.leaf_update_count
            +ios.leaf_page_merge_count+ios.singleton_lookup_count
           )total_changes
FROM    sys.dm_db_index_operational_stats(DB_ID(),NULL,NULL,NULL)ios
        JOINsys.objectssoONso.object_id=ios.object_id
        JOINsys.indexessiONsi.object_id=ios.object_id
                               ANDsi.index_id=ios.index_id
        JOINsys.schemasssONso.schema_id=ss.schema_id
WHERE   OBJECTPROPERTY(ios.object_id,'IsUserTable')= 1
ORDERBYleaf_changesDESC

To check index fragmentation:
SELECT  a.index_id,
        b.nameAS[object_name],
        CONVERT(NUMERIC(5,2),a.avg_fragmentation_in_percent)pct_avg_fragmentation
FROM    sys.dm_db_index_physical_stats(DB_ID(),NULL,NULL,NULL,NULL)ASa
        JOINsys.indexesASbONa.object_id=b.object_id
                                 ANDa.index_id=b.index_id;


Let’s get started:

1.       Create the database and table:

CREATEDATABASETestDB
GO
USE[TestDB]
GO

CREATETABLE[tblLarge](
       [xID][int]IDENTITY(1,1)NOTNULL,
       [sName1][varchar](10)NULL,
       [sName2][varchar](13)NULL,
       [sName3][varchar](36)NULL,
       [sIdentifier][char](2)NULL,
       [dDOB][date]NULL,
       [nWage][numeric](12, 2)NULL,
       [sLicense][char](7)NULL,
       [bGender][bit]NULL
)ON[PRIMARY]
GO


2.       Start the SQL Profiler Trace and we can filter the trace for the SPID which we are using to execute query.
3.       Run the following INSERT statement in a loop to insert 10,000 records.

DECLARE@nINT= 0
BEGINTRAN
WHILE@n<= 10000
      BEGIN
            INSERT  INTOtblLarge
                    (sName1,
                      sName2,
                      sName3,
                      sIdentifier,
                      dDOB,
                      nWage,
                      sLicense,
                      bGender
                    )
            VALUES  (LEFT(CAST(NEWID()ASVARCHAR(36)), 8),
                      LEFT(CAST(NEWID()ASVARCHAR(36)), 13),
                      CAST(NEWID()ASVARCHAR(36)),
                      LEFT(CAST(NEWID()ASVARCHAR(36)), 2),
                      DATEADD(dd,-RAND()* 20000,GETDATE()),
                      (RAND()* 1000 ),
                      SUBSTRING(CAST(NEWID()ASVARCHAR(36)), 6, 7),
                      COALESCE(ISNUMERIC(LEFT(CAST(NEWID()ASVARCHAR(36)),1)),0)
                    )
            SET@n=@n+ 1
      END
COMMITTRAN

4.       Drop the existing table. Then create the same table, along with a clustered index and five non-clustered indexes.

ALTERTABLEtblLargeADDCONSTRAINT PK_tblLarge
PRIMARYKEYCLUSTERED (xID)WITH (FILLFACTOR=90)

CREATENONCLUSTEREDINDEXIX_tblLarge_sIdentifierONtblLarge(sIdentifier)
INCLUDE (sName1,sName2)WITH (FILLFACTOR=90)

CREATENONCLUSTEREDINDEXIX_tblLarge_sName1ONtblLarge(sName1)
INCLUDE (sIdentifier,sName2)WITH (FILLFACTOR=90)

CREATENONCLUSTEREDINDEXIX_tblLarge_sName2ONtblLarge(sName2)
INCLUDE (dDOB,nWage)WITH (FILLFACTOR=90)

CREATENONCLUSTEREDINDEXIX_tblLarge_sName3ONtblLarge(sName3)
INCLUDE (sIdentifier,nWage,sLicense)WITH (FILLFACTOR=90)

CREATENONCLUSTEREDINDEXIX_tblLarge_dDOBONtblLarge(dDOB)
INCLUDE (sIdentifier,sName1,sName2,sName3)WITH (FILLFACTOR=90)

5.       Run the INSERT statement again and collect DMV and SQL Profiler output. Below are all the captured outputs:

Figure #1:Inserting 10000 records in a Heap
  
Figure #2:DMV output when inserting 10,000 records in a clustered table and when there are five non-clustered indexes
 
Figure #3:SQL Profiler traces output


Points from test:
From our above simple test we may conclude the following:
1.       When a table is HEAP, INSERT is fast.
2.       The INSERT statement is much more expensive when having indexes in terms of CPU, Duration, Read and Writes.
3.       When we have clustered and non-clustered indexes, due to INSERT, page splits occurs in leaf and non-leaf level.
4.       Fragmentation on all non-clustered indexes increases rapidly. However, fragmentations on clustered indexes are low.

Summary:
As we saw from our test that having indexes does have operational costs, but it does not make sense to stop creating useful indexes. If indexes are necessary then we should create it judiciously while ensuring all the best practices.   

How many indexes are too many?  As many as required.

References:
Learn from Guru: Paul S. Randal

Expert Performance Indexing for SQL Server 2012 (aprèss book)
Jason Strate and Ted Krueger

Specify Fill Factor for an Index

ALTER INDEX (Transact-SQL)


System database issues: rebuild, relocation and restore - Are we ready?

$
0
0
"What is the probability that the sun will NOT rise tomorrow?"
“What is the probability that the master database will NOT corrupt tomorrow?”

To answer the first question, we have to live billions of lights years, even more, I don’t know.
But I believe that the master database may corrupt tomorrow; it could be happening right now while you are reading this article. Are we ready to recover it?

In this article, we will be recovering the master database after a disaster (later on msdb, model and tempdb). When the master database has an issue, SQL Server will not start and we may see startup errors.

Good practices and good to know about master database:
Consider following recommendations:

1.        Always have a current backup of the master database available and perform system databases backup, daily basis.
2.        Perform file copy (mdf and ldf) when you stop SQL Server service during maintenance window.
3.        When there is a configuration change, do a backup before and after.
4.        Back up the master database as soon as possible after the following operations:
(a)    Creating, modifying, or dropping any database
(b)    Changing server or database configuration values
(c)     Modifying or adding logon accounts.
5.        Do not create user objects in master.
6.        Do not set the TRUSTWORTHY option to ON for the master database.
7.        Repairing system databases is not an option.
8.        Run database consistency and make sure it’s healthy.
9.        Create alerts to get earliest possible notifications for any issues that could occur.
10.    Never change configuration of any system database except the model database
11.    Location can be changed in SQL Server Configuration Manager.

Part One: Master Database:
We will review all system database’s recovery option. In our first part, we will work on the master database only.

Recovering the master database (figure # 1):
So, SQL Server 2012 (also 2005, 2008) will not start and threw an error. Following are the steps to restore the master database from the latest backup.

(a)    Open the Command prompt with administrative privileges.
(b)   Start the SQL Server Service in a single-user mode as follows:
(1)    Default instance:
C:\>NET START MSSQLSERVER /m
(2)    Named Instance:
C:\>NET START MSSQL$InstanaceName /m
e.g. C:\>NET START MSSQL$HealthCanada01 /m

Note: Replace server name and instance name to match your case

(c)    Now start the sqlcmd from command prompt
(1)    Default instance:
C:\>sqlcmd
(2)    Named instance:
C:\>sqlcmd  -SYourServer\InstanceName
e.g.C:\>sqlcmd –SmyWinServer\HealthCanada01

Note: Replace server name and instance name to match your case

(d)   In the sqlcmd command window, run the following command:
>RESTORE DATABASE master FROM DISK=’H:\DBBackup\master_backup.BAK’ WITH REPLACE
>GO

Note: Replace path and backup file name to match your case

(e)   As soon as the restore is done, SQL Server service will be terminated. Now Restart the SQL Server service by using SQL Server Configuration Manager or by using the NET START command:

Figure # 1:Restoring the master database from the latest backup.

Rebuild the master database (figure # 2):
We may need to rebuild the master database if:
(a)    After installation, the collation setting needs to change.
(b)   The master database is corrupt and there is no backup.

Following are the step by step processes to rebuild the master database. In SQL 2008R2 and SQL 2012 there is no need for setup DVD/ISO. Please note that rebuilding the master database will create all three databases - master, model and msdb.

(a)    Open the Command prompt with administrative privileges.
(b)   Go to the following folder:

SQL Server 2008R2:
C:\> CD  C:\Program Files\Microsoft SQL Server\100\Setup Bootstrap\SQLServer2008R2

SQL Server 2012:
C:\> CD  C:\Program Files\Microsoft SQL Server\110\Setup Bootstrap\SQLServer2012

SQL Server 2005: See this article:

SQL Server 2008: See this article

(c)    Use the following command and fit your requirement as well:

Syntax:
setup.exe
/QUIET
/ACTION=REBUILDDATABASE
/INSTANCENAME=instance_name
/SQLSYSADMINACCOUNTS=domain\ accounts
[/SAPWD=new_password]        
[/SQLCOLLATION=new_collation_name]

To rebuild the default instance:
setup /ACTION=REBUILDDATABASE /QUIET /INSTANCENAME=MSSQLSERVER /SQLSYSADMINACCOUNTS=ARIBU\sqladmin /SAPWD=myPassw0rd

To rebuild the default instance to change collation:
setup /ACTION=REBUILDDATABASE /QUIET /INSTANCENAME=MSSQLSERVER /SQLSYSADMINACCOUNTS=ARIBU\sqladmin /SQLCOLLATION=SQL_Latin1_General_CP1_CI_AS

To rebuild the named instance (HealthCanada01):
setup /ACTION=REBUILDDATABASE /QUIET /INSTANCENAME= HealthCanada01 /SQLSYSADMINACCOUNTS=ARIBU\sqladmin /SQLCOLLATION=SQL_Latin1_General_CP1_CI_AS

To rebuild the named instance (HealthCanada01) with sa password and to change collation:
setup /ACTION=REBUILDDATABASE /QUIET /INSTANCENAME= HealthCanada01 /SQLSYSADMINACCOUNTS=ARIBU\sqladmin /SAPWD=myPassw0rd /SQLCOLLATION=SQL_Latin1_General_CP1_CI_AS

(d)   Once the master database is built, we need to reconfigure various settings again, such as login, Linked server, Server wide settings, and so on. It is also a good idea to apply SQL Server patches after rebuilding the master database.  

Figure # 2:Rebuilding the master database.
In the above screenshot I ran the following command:
setup /ACTION=REBUILDDATABASE /QUIET /INSTANCENAME=MSSQLSERVER /SQLSYSADMINACCOUNTS=ARIBU\sqladmin /SAPWD=1amThe$a /SQLCOLLATION=SQL_Latin1_General_CP1_CI_AS

Changing the location of master database:
In some situations, we need to start SQL Server Service by changing the location of the master database. This can be done in command prompts or from SQL Server Service Manager. Below is a screenshot (figure # 3) for starting a SQL Server 2012 Service when master database sits in a different location other than the default location.


Figure # 3:New location of master database.


Part Two: msdb and model:
Changing location of msdb or model database:
To move the model and msdb system database data or log file because of a hardware failure or in a planned location, follow these steps to relocate the file to a new location.

1.       Stop the instance of Microsoft SQL Server 2005/2008/208R2/2012 if it is started.
2.       Start the instance of Microsoft SQL Server Service in master-only recovery mode by entering one of the following commands at the command prompt.

For the default (MSSQLSERVER) instance, run the following command.
NET START MSSQLSERVER /f /T3608 /T4022

For a named instance, run the following command.
NET START MSSQL$instancename /f /T3608 /T4022

3.       For each file to be moved, use sqlcmd commands or SQL Server Management Studio to run the following statement.

ALTER DATABASE database_name  
MODIFY FILE( NAME = logical_name , FILENAME = 'new_path\os_file_name' )

4.       Exit the sqlcmd utility or SQL Server Management Studio.
5.       Stop the instance of Microsoft SQL Server.
6.       Move the file or files to the new location.
7.       Restart the instance of Microsoft SQL Server. For example, run

NET START MSSQLSERVER or
NET START MSSQL$instancename

8.       Verify the file change by running the sp_helpfile.


After Moving All System Databases:
If we have moved all of the system databases to a new drive or volume or with a different drive letter/folder, we need to change the SQL Server Agent log path. If we do not update this path, SQL Server Agent will fail to start.

To change the SQL Server Agent Log Path:
1.     From SQL Server Management Studio, in Object Explorer, expand SQL Server Agent.
2.     Right-click Error Logs and click Configure.
3.     In the Configure SQL Server Agent Error Logs dialog box, specify the new location of the SQLAGENT.OUT file.
 
Example of relocating msdb and model database:
In this example, we will move the msdb and model database to a new location, which is “H:\SQLSystemDB”.  Prior to stop SQL Server Service collect the logical and OS file name (use sp_helpfile)

To execute the ALTER DATABASE command we can use sqlcmd.

For msdb:
ALTERDATABASEmsdb
MODIFYFILE(NAME=MSDBData,FILENAME='H:\SQLSystemDB\MSDBData.mdf')
ALTERDATABASEmsdb
MODIFYFILE(NAME=MSDBLog,FILENAME='H:\SQLSystemDB\MSDBLog.ldf')
GO

Figure # 4:msdb database relocation:

For model:
ALTERDATABASEmodel
MODIFYFILE(NAME=modeldev,FILENAME='H:\SQLSystemDB\model.mdf')
ALTERDATABASEmodel
MODIFYFILE(NAME=modellog,FILENAME='H:\SQLSystemDB\modellog.ldf')
GO

Figure # 5: model database relocation:

Restoring msdb and model database:
So far restoring the msdb and model database from backup is somehow misleading (??).Thus, a common trick is to restore the model and msdb database in a different instance of SQL Server which has same Edition/Build and then copy back the mdf and ldf to the folder.


Part three: tempdb startup issue:
Relocating tempdb is one of the simplest task and it can be done when SQL Server service is up and running. However, reallocating tempdb data files will not be in effect until the SQL Server Service restarts. But if we add data files to tempdb this will take effect as soon as the creation has been done.

SQL Server startup issue may occur due to following reasons:

1.       Drive failure of tempdb,
2.       Unavailability or change of folder/drive

Resolving tempdb issue:
To rectify the startup issue with SQL Server due to unavailability of tempdb, following are the steps

1.       Open the command prompt with administrative privilege
2.       Start the SQL Server service with following command

Default instance: NET START MSSQL SERVER /f /T3608
Named Instance: NET START MSSQL$InstanceName /f /T3608
3.       Open the sqlcmd command window

Default instance: C:\>sqlcmd
Named Instance: C:\>sqlcmd -SComputername\InstanceName

4.       We can query the sys.master_files to get the logical name of each data file and corresponding physical name with location of each data file. Execute following command:

SELECT  name,
        physical_name
FROM    sys.master_files
WHERE   database_id= 2

5.       In the sqlcmd window run the ALTER DATABASE command

Syntax:
ALTERDATABASEdatabase_name
MODIFYFILE(NAME=logical_name,FILENAME='new_path\os_file_name')

Example for tempdb (one data and one log):
ALTERDATABASEtempdb
MODIFYFILE(NAME=tempdev,FILENAME='H:\tempdb\tempdb.mdf')
ALTERDATABASEtempdb
MODIFYFILE(NAME=templog,FILENAME='H:\tempdb\templog.ldf')
GO

6.       Restart SQL Server as usual without any switch and trace flag.


Relocating tempdb data files:
Here are two examples for “how to move tempdb” to a different location.

Following is the example (figure # 6) to move tempdb from its default location “C:\Program Files\Microsoft SQL Server\MSSQL11.MSSQLSERVER\MSSQL\DATA” to a new location “H:\tempdb” in SQL Server 2012.

Figure # 6: tempdb move to a new location


Following is the example (figure # 7) to move tempdb from the location “H:\tempdb” to a new location “H:\tempdbNew” in SQL Server 2012, where we have 4 data files and 1 log file.

Figure # 7:tempdb move to a new location (muiltiple data files)


Figure # 7A:tempdb move to a new location (muiltiple data files)


Figure # 7B:tempdb move to a new location (muiltiple data files)


Reference and Read More:
Move System Databases

The SQL Server Instance That Will not Start (written by Gail Shaw)

Rebuild System Databases
http://msdn.microsoft.com/en-us/library/dd207003.aspx


Rebuilding master database:

Missing Index DMVs – misleading suggestions

$
0
0
Creating missing indexes is one of DBA’s core responsibilities in the production environment and makes the query execution much faster. A lot of enhancement has been done and new features have been added starting from SQL 2005 that make our day to day task more efficient and easier.

1.       Execution plan with tooltips and details properties.
2.       DMVs for missing indexes - index operational status and usages.

Where do you want to go from here?
While DMVs are great to begin with, there is a glitch with the output which we need to be aware of. When missing index information was added to the catalog views, SQL Server Query Optimizer does not consider existing indexes for the underlying table at all as suggests. It adds column name when a query is compiled or recompiled.

So if we consider these recommendations blindly, then we will end up creating a large number of indexes which is certainly not useful. Rather than improving the performance it will degrade the overall performance.


Missing Columns DMO:
Dynamic management object
Information returned
Returns summary information about missing index groups.
Returns information about a specific group of missing indexes
Returns detailed information about a missing index
Returns information about the database table columns that are missing an index.


Things to keep in mind about missing indexes DMV:
The missing indexes feature is a lightweight tool for finding missing indexes that might significantly improve query performance. It does not provide adequate information to fine tune indexing configuration. Below are some limitations:

1.       By default, the missing indexes feature is turned on.
2.       No controls are provided to turn the feature on or off, or to reset any of the tables returned when the dynamic management objects are queried.
3.       When SQL Server is restarted, all of the missing index information is dropped.
4.       This feature can only be disabled if an instance of SQL Server is started by using the -x argument with the “sqlservr.exe” command-prompt utility.
5.       Missing index DMVs are updated when a query is optimized by the query optimizer.
6.       Missing index information from “Estimate Execution Plan” will differ from “Actual Execution Plan”.
7.       It does not provide partitioning.
8.       It suggests to include a clustered index key with the INCLUDE option.
9.       It is not intended to fine tune an indexing configuration.
10.   It cannot gather statistics for more than 500 missing index groups.
11.   It does not specify an order for columns to be used in an index.
12.   For queries involving only inequality predicates, it returns less accurate cost information.
13.   It reports only include columns for some queries, so index key columns must be manually selected.
14.   It returns only raw information about columns on which indexes might be missing.
15.   It does not suggest filtered indexes.
16.   It can return different costs for the same missing index group that appears multiple times in XML Showplans.
17.   It does not consider trivial query plans.
18.   If a transaction creates or drops a table, the rows containing missing index information about the dropped objects are removed from the missing index management object.
19.   When the metadata for a table changes, all missing index information about that table is deleted from these dynamic management views.

Good practices:
Consider the following when using missing index DMVs to create or adjust indexes:

1.       Try to consolidate all the recommendations into a fewer number of indexes.
2.       Never include a clustered key in the index key columns or with the INCLUDE column.
3.       If an existing index needs to be adjusted, always use DROP_EXISING=ON with the CREATE INDEX statement.
4.       unique_compile” in “sys.dm_db_missing_index_group_stats” will tell us how many times a query has been complied or recompiled because of this missing index group.
5.       Review related queries and query execution plans along with missing index suggestions.

General Guidelines while using missing DMVs:
To convert the information returned by “sys.dm_db_missing_index_details” into a CREATE INDEX statement, consider the following the guidelines:

1.       Equality columns should be put before the inequality columns, and together they should make the key of the index. For example

EQUALITY = col1, col5
INEQUALITY = col3, col7
Index key will be: col1 + col5 + col3 + col7

2.       To determine an effective order for the equality columns, order them based on their selectivity: put the most selective columns (most unique value column) first (leftmost in the column list). For example, say col1, col2 and col3 has following distinct records

DISTINCT col1 = 100
DISTINCT col2 = 10
DISTINCT col3 = 60

Index Key will be: Col1 + Col3 + Col2

3.       Included columns should be added to the CREATE INDEX statement using the INCLUDE clause minus the clustered key. For example,

xID = Clustered key
nCustID = Key column
sName1= Non key column
dDOB= Non key column

Good:CREATE INDEX IX_nCustID ON Table1 (nCustID) INCLUDE (sName1, dDOB)
Bad:CREATE INDEX IX_nCustID ON Table1 (nCustID) INCLUDE (xID, sName1, dDOB)
Ugly:CREATE INDEX IX_nCustID ON Table1 (nCustID,xID) INCLUDE (sName1, dDOB)

4.       Column orders in INCLUDE option has no effect, for example INCLUDE (ColA, ColB, ColC) is the same as INCLUDE (ColB, ColA, ColC).

A practical way to create missing indexes:
In this exercise, we will be reviewing how to consolidate all recommendations about missing indexes and how to create the most beneficial one. To perform this test, Server 2012 is used however any SQL Server edition can be used.

DMV Query to find missing indexes and relevant information:

SELECTsys.schemas.schema_id
     ,sys.schemas.nameASschema_name
     ,sys.objects.object_id
     ,sys.objects.nameASobject_name
     ,sys.objects.type
     ,partitions.rows_count
     ,partitions.size_mb
     ,migs.unique_compiles
     ,mid.equality_columns
     ,mid.inequality_columns
     ,mid.included_columns
     ,migs.user_seeks
     ,migs.user_scans
     ,migs.avg_total_user_cost
     ,migs.avg_user_impact
     ,migs.last_user_seek
     ,migs.last_user_scan
     ,migs.system_seeks
     ,migs.system_scans
     ,migs.avg_total_system_cost
     ,migs.avg_system_impact
     ,migs.last_system_seek
     ,migs.last_system_scan
     ,(convert(NUMERIC(19, 2),migs.user_seeks)+convert(NUMERIC(19, 2),migs.unique_compiles))
       *convert(NUMERIC(19, 2),migs.avg_total_user_cost)
       *convert(NUMERIC(19, 2),migs.avg_user_impact/ 100.0)ASscore
FROM
  sys.objects
  JOIN(SELECTobject_id
             ,sum(CASE
                 WHENindex_idBETWEEN 0 AND 1 THEN
                   row_count
                 ELSE
                   0
               END)ASrows_count
             ,convert(NUMERIC(19, 2),convert(NUMERIC(19, 3),sum(in_row_reserved_page_count+lob_reserved_page_count
               +row_overflow_reserved_page_count))/convert(NUMERIC(19, 2), 128))ASsize_mb
        FROM
          sys.dm_db_partition_stats
        WHERE
          sys.dm_db_partition_stats.index_idBETWEEN 0 AND 1
        GROUPBY
          object_id
       )ASpartitions
    ONsys.objects.object_id=partitions.object_id
  JOINsys.schemas
    ONsys.objects.schema_id=sys.schemas.schema_id
  JOINsys.dm_db_missing_index_detailsmid
    ONsys.objects.object_id=mid.object_id
  JOINsys.dm_db_missing_index_groupsmig
    ONmid.index_handle=mig.index_handle
  JOINsys.dm_db_missing_index_group_statsmigs
    ONmig.index_group_handle=migs.group_handle
WHERE
  mid.database_id=db_id()

Let’s do a simple test:

1.       Create the database and table:

CREATEDATABASETestDB
GO
USE[TestDB]
GO

CREATETABLE[tblLarge](
       [xID][int]IDENTITY(1,1)NOTNULL,
       [sName1][varchar](10)NULL,
       [sName2][varchar](13)NULL,
       [sName3][varchar](36)NULL,
       [nCustID]INTNULL,
       [sIdentifier][char](2)NULL,
       [dDOB][date]NULL,
       [nWage][numeric](12, 2)NULL,
       [sLicense][char](7)NULL,
       [bGender][bit]NULL
)ON[PRIMARY]
GO

2.       Run the following INSERT statement in a loop to insert 1,300,000 records.

SETNOCOUNTON
INSERT  INTOtblLarge
        (sName1,
          sName2,
          sName3,
          nCustID,
          sIdentifier,
          dDOB,
          nWage,
          sLicense,
          bGender
                   
        )
VALUES  (LEFT(CAST(NEWID()ASVARCHAR(36)),RAND()* 10),
          LEFT(CAST(NEWID()ASVARCHAR(36)),RAND()* 11),
          CAST(NEWID()ASVARCHAR(36)),
          FLOOR(RAND()* 10000),
          LEFT(CAST(NEWID()ASVARCHAR(36)), 2),
          DATEADD(dd,-RAND()* 20000,GETDATE()),
          (RAND()* 1000 ),
          SUBSTRING(CAST(NEWID()ASVARCHAR(36)), 6, 7),
          COALESCE(ISNUMERIC(LEFT(CAST(NEWID()ASVARCHAR(36)), 1)), 0)
        )
      
GO 1300000

3.       Create a clustered index on the xID Column.

ALTERTABLEtblLargeADDCONSTRAINT PK_tblLarge
PRIMARYKEYCLUSTERED (xID)WITH (FILLFACTOR=90)

4.       Execute the following SELECT statements several times to get missing index suggestions:

-- First query
SELECT  nCustID,
        sName1,
        sName2,
        dDOB
FROM    tblLarge
WHERE   dDOBBETWEEN'2010-05-29'AND'2010-10-25'
        ANDnCustIDBETWEEN 10 AND 1000
ORDERBYnCustID

-- Query Two
SELECT  nCustID,
        sName1,
        sIdentifier
FROM    tblLarge
WHERE   sIdentifier='AA'
        ANDdDOBBETWEEN'2000-01-01'AND'2010-10-10'
ORDERBYnCustID

-- Query Three
SELECT  nCustID,
        COUNT(nCustID)nCount
FROM    tblLarge
WHERE   nCustIDBETWEEN 50 AND 150
        ANDdDOBBETWEEN'2005-01-01'AND'2010-10-10'
GROUPBYnCustID

-- Query Four
SELECT  nCustID,
        sName1,
        sName2,
        sIdentifier
FROM    tblLarge
WHERE   nCustID>= 100
        ANDnCustID<= 500
        ANDsIdentifierLIKE'B%'

5.        After executing all the given queries, we can get the following missing index recommendations if we run the DMV query listed above.

6.       Index creation: Based on the missing index recommendations, we may create the following two indexes which will help all queries.

CREATENONCLUSTEREDINDEXIX_nCustID
ON[dbo].[tblLarge]([nCustID],[dDOB])
INCLUDE ([sName1],[sName2])
GO

CREATENONCLUSTEREDINDEXIX_sIdentifier
ON[dbo].[tblLarge]([sIdentifier],[dDOB])
INCLUDE ([sName1],[sName2],[nCustID])
GO

7.       Our second query needs a little optimization. When a key column is index, then the Explicit ORDER BY on that column is not necessary. If we remove the “ORDER BY nCustID” the Sort operator in the execution plan will disappear.


Figure # 1A: Query Execution Plan with missing Indexes

Figure # 1B: Missing Index suggestions
Figure #2: Query Execution Plan after Missing Index creation

Summary:
Missing index DMVs are a great tool to use to understand the index requirements if it is being used cautiously. There are tons of robotic index creation scripts that are available to create missing indexes by utilizing DMVs and none of them consider the limitations of those DMV’s.  Mainly, the beginners get trapped and end up creating a number of inefficient indexes.

If we review the Query, Execution Plan and missing index DMVs while creating indexes, then this combination will be a great mechanism to create the most efficient indexes. However, solely using the missing DMV’s will not evaluate the situation effectively nor correctly.

Network Binding Order – SQL 2012 Failover Cluster Installation

$
0
0
“The domain network is not the first bound network. This will cause domain operations to run slowly and can cause timeouts that result in failures. Use the Windows network advanced configuration to change the binding order.”

The “Network binding order” warning message usually arises when SQL Server cluster rule check is performed. Many sysadmin and dba ignore this warning as they think that this warning may not be an issue as they have done everything correctly. Should we ignore this message? Off course not!

This warning should be resolved as soon as possible, although SQL Server cluster installation allows installing SQL Server without showing any further warnings. But the consequence of this misconfiguration can seriously degrade Network performance if the NIC order stayed in an inappropriate way. Many Network packets will fail, and the Network protocol will not proceed further until that failure occurs. As a result, the network throughput will be reduced and a time-out issue will occur.

In this article we will be fixing the issue in easy way. Please note that this fix is equally applicable to all versions of Windows and SQL Server installation.

Test Environment:

1.       A two node Windows 2012 Cluster.
2.       Domain name: aribu.net.
3.       Two NIC Cards: Ethernet1 and Ethernet2.
4.       One NIC for cluster heart beat in each node.
5.       The entire environment is running inside VMWare ESXi 5.1.

VB Script to check Network Binding Order:
Following the script I have collected from a MSDN blog site (link given at the bottom). You can save the script with vbs extensions and run it in each node to see if there is a network binding issue. We can perform this test before starting of SQL Server installation and correct any binding orders reported. We can also check the “network binding order” any time and fix it if the issue exists.

The VB script:

Const HKCU = &H80000001
Const HKLM = &H80000002

strComputer = "."
strUDN = "User Domain Name"
strFNDN = "First NIC Domain Name"
Set oReg=GetObject("winmgmts:\\"& strComputer & "\root\default:StdRegProv")

Wscript.Echo "The User DNS Domain name should (case insensitive) match the Domain Name against the first NIC in the binding list."

Return = oReg.GetStringValue(HKCU,"Volatile Environment","USERDNSDOMAIN",strUDN)
If (Return = 0) And (Err.Number = 0) Then
 Wscript.Echo "User DNS Domain : "& strUDN
Else
 Wscript.Echo "Error retrieving User DNS Domain!! "
End If

Return = oReg.GetMultiStringValue(HKLM,"SYSTEM\CurrentControlSet\services\Tcpip\Linkage","Bind",mstrValues)


If (Return = 0) And (Err.Number = 0) Then
 For Each strValue In mstrValues
  oNICGuid = split(strValue,"\",-1)(2)
  Return = oReg.GetStringValue(_
   HKLM,_
   "SYSTEM\CurrentControlSet\Services\Tcpip\Parameters\DNSRegisteredAdapters\"& oNICGuid,_
   "PrimaryDomainName",_
   strPDN)
  If (Return = 0) And (Err.Number = 0) Then
   Wscript.Echo oNICGuid & "  : "& strPDN
   If (strValue = mstrValues(0)) Then
    strFNDN = strPDN
   End If
  
  Else
   Wscript.Echo oNICGuid & "  : -NA or None Found- "
  End If
 Next
Else
    Wscript.Echo "GetMultiStringValue failed. Error = "& Err.Number & " returned "& Return
End If


If StrComp(strUDN, strFNDN, vbTextCompare) Then
 Wscript.Echo "PROBLEM!!!! : "& strUDN & "<> "& strFNDN
Else
 Wscript.Echo "All is OK!! : "& strUDN & " = "& strFNDN
End If

Wscript.Echo "All done.."
 
The outputs from the above VBScript code tell us that there is a Network bind order issue. In my case, the domain “aribut.net” is not pointing to the first network card. Thus we need to take note of the corresponding GUID from the pop up. Following are the screenshots:

Figure #1: GUID and corresponding domain


.
Figure #2: Network binding issue


Let’s start install SQL Cluster:
Start the SQL Server cluster installation then will see that the cluster rule check process reports the following error:

Figure#3: Network binding order issue detected


SQL Server“…\Setup Bootstrap\log\......\detail.txt” gives the following logged message.

Figure#4: Warning message in setup bootstrap


Now if we check the Network connection’s advanced options, we will find that the network binding order is correct. No issues here (figure#5A, B), but SQL Server installation is still giving us a warning. Though Windows is showing it is in the correct binding order, registry somehow did not get updated.

Figure#5A: Network Connection


Figure#5B: Network Connection – advanced option


How to fix?
To fix the binding order, we need to edit and rearrange the registry key. Following is a step by step guideline to resolve a “Network Binding Order” issue. In our case the GUID “8FAC2E71-1E2B-4BBC-8B9F-DD05AB4F63F3 ” must be on the top in the registry key array.

1.       Open the registry editor (regedit.exe)
2.       Locate the following key:

HKEY_LOCAL_MACHINE\SYSTEM\CurrentControlSet\services\Tcpip\Linkage

3.       Open the bind key (figure#6). Locate the GUID associated with the domain we took note on with the VB Script earlier or the GUID reported in setup bootstrap “detail.txt”. In our case the GUID is follows (marked in yellow).

8FAC2E71-1E2B-4BBC-8B9F-DD05AB4F63F3 = aribut.net

Figure#6: Registry Editor for “Network Binding order


4.       Cut the GUID value (which is 8FAC2E71-1E2B-4BBC-8B9F-DD05AB4F63F3 in figure#7) in the registry editor and move it to the top (figure#8). Save and exit. We are done.

Figure#7: GUID is the second place (before correction)


Figure#8:GUID in the top place (after correction)


The Issue is Resolved:
Now re-run the VB Script or SQL Server Cluster Rule Check; the “Network Binding Order” warning disappears as shown in the following figure#9.

Figure#9: Resolved network binding issue


Summary:
I hope this guide will help you to resolve the mysterious “Network Binding Order” issue. This issue needs to be fixed in any SQL Server installation.

See More:
Network Binding Order Rule Warning in SQL Server 2008 Cluster Setup Explained

Network Binding Order Warning in SQL Server 2008R2 Cluster Installation

“ANSI_NULLS”, “JOIN/WHERE” and “Query Optimizer” - story of the three stooges

$
0
0

A friend of mine who lives in Nova Scotia is managing a couple of large busy OLTP database servers. A few days ago, he asked me curiously, what’s going on with “ANSI_NULLS” here. Although, the “ANSI_NULLS” setting is simple but the misconfiguration or misuse of this setting can cause unbelievable performance impact. From my experience, I have seen many experts getting stressed to resolve this mysterious performance issue or to find out the root cause.


There is a very close relation among “ANSI_NULLS”, “JOIN/WHERE” and “Query Optimizer” when a query and its search column contains NULL values. Microsoft SQL Server suggests that when a Stored Procedure (P), Trigger (T), and others get created the following two settings must be executed right before creating or modifying any P, V, IV, IF, FN, T and TF from the same connection. For example,

SETANSI_NULLSON
GO
SETQUOTED_IDENTIFIERON
GO

CREATE/ALTERPROCEDUREusp_PROC
AS
    BEGIN
       -- T-SQL Code goes here
    END
GO

The “ANSI_NULLS” setting is basically for SQL Server Query optimizer. That said, when the Query Optimizer creates an Execution Plan it checks the Index and table properties to incorporate any object level settings specified when a stored procedure is created. So if the “ANSI_NULLS” is tuned off then SQL Server Query Optimizer must first scan the table or index for “NULL” and then filter the result set with a “SORT” operator. This query execution behavior is by design.

MSDN explains “ANSI_NULLS” as follows:

1.      When SET ANSI_NULLS is ON, a SELECT statement that uses WHERE column_name = NULL returns zero rows even if there are null values in column_name. A SELECT statement that uses WHERE column_name <> NULL returns zero rows even if there are nonnull values in column_name.

When SET ANSI_NULLS is ON, all comparisons against a null value evaluate to UNKNOWN. When SET ANSI_NULLS is OFF, comparisons of all data against a null value evaluate to TRUE if the data value is NULL. If SET ANSI_NULLS is not specified, the setting of the ANSI_NULLS option of the current database applies.

2.      When SET ANSI_NULLS is OFF, the Equals (=) and Not Equal To (<>) comparison operators do not follow the ISO standard. A SELECT statement that uses WHERE column_name = NULL returns the rows that have null values in column_name. A SELECT statement that uses WHERE column_name <> NULL returns the rows that have nonnull values in the column. Also, a SELECT statement that uses WHERE column_name <> XYZ_value returns all rows that are not XYZ_value and that are not NULL.

The “ANSI_NULLS” setting can be overridden explicitly by putting the command in the top of the batch or inside the stored procedure. However, doing so will prevent plan reuse and query will be recompiled in every execution.

Good Practices and Good to Know:
1.      Always use “SET ANSI_NULLS ON” while creating stored procedures or indexes.
2.      Avoid using “SET ANSI_NULLS” inside a stored procedure.
3.      Indexed view and computed column requires “SET ANSI_NULLS ON” otherwise “UPDATE/INSERT” will fail.
4.      “LEFT JOIN” usually a costly operation; try to use “INNER JOIN” if possible.
5.      Use more filters on the “JOIN" or “WHERE” clause.
6.      Use “IS NULL” or “IS NOT NULL” keyword with the “JOIN” or the “WHERE” clause.
7.      Misuse of “ANSI_NULLS” causes parameter sniffing.
8.      “ANSI_NULLS” setting can be changed server-wide, per database basis and in a T-SQL batch/stored procedure.


Caution:
“In a future version of SQL Server, ANSI_NULLS will always be ON and any applications that explicitly set the option to OFF will generate an error. Avoid using this feature in new development work, and plan to modify applications that currently use this feature.”

Default SET Commands:

SET
Command
Applications using
ADO .Net, ODBC or OLE DB
SSMS,
Query Analyzer
SQLCMD,
OSQL, BCP,
SQL Server Agent
ISQL,
DB-Library
ANSI_NULL_DFLT_ON
ON
ON
ON
OFF
ANSI_NULLS
ON
ON
ON
OFF
ANSI_PADDING
ON
ON
ON
OFF
ANSI_WARNINGS
ON
ON
ON
OFF
CONACT_NULLS_YIELD_NULL
ON
ON
ON
OFF
QUOTED_IDENTIFIER
ON
ON
OFF
OFF
ARITHABORT
OFF
ON
OFF
OFF

Observing the Query Execution Behavior:
We will examine the query execution behavior with or without the “ANSI_NULLS” setting. Later we will try to optimize the Query so that it will run in any setting conditions.
Testing the Behavior:
1.      Create a sample database and two tables.
2.      Add records with and without “NULL” values.
3.      Create clustered key and index.
4.      Create Stored Procedure with ON and OFF settings.
5.      Rewrite the query to deal with any situations.

Script to Create database and tables:

SETNOCOUNTON
IFOBJECT_ID('tblLarge')ISNOTNULL
   DROPTABLEtblLarge
GO

CREATETABLEtblLarge
       (
         xIDINTIDENTITY(1, 1),
         sName1VARCHAR(100),
         sName2VARCHAR(1000),
         sName3VARCHAR(400),
         sIdentifierCHAR(100),
         dDOBDATETIMENULL,
         nWageNUMERIC(20, 2),
         sLicenseVARCHAR(25)
       )
GO

/******************************************************
Add 1000 or more/less records with non-blank dDOB
******************************************************/
SETNOCOUNTON
INSERT  INTOtblLarge
        (sName1,
          sName2,
          sName3,
          sIdentifier,
          dDOB,
          nWage,
          sLicense
        )
VALUES  (LEFT(CAST(NEWID()ASVARCHAR(36)),RAND()* 50),    -- sName1
          LEFT(CAST(NEWID()ASVARCHAR(36)),RAND()* 60),    -- sName2
          LEFT(CAST(NEWID()ASVARCHAR(36)),RAND()* 70),    -- sName2
          LEFT(CAST(NEWID()ASVARCHAR(36)), 2),              -- sIdentifier    
          DATEADD(dd,-RAND()* 20000,GETDATE()),            -- dDOB or NULL
          (RAND()* 1000 ),                                  -- nWage
          SUBSTRING(CAST(NEWID()ASVARCHAR(36)), 6, 7)        -- sLicense       
        )
GO 1000


/******************************************************
Add 1000 or more/less records with dDOB = NULL
******************************************************/
SETNOCOUNTON
INSERTINTOtblLarge
(sName1,
sName2,
sName3,
sIdentifier,
dDOB,
nWage,
sLicense
)
VALUES(LEFT(CAST(NEWID()ASVARCHAR(36)),RAND()* 50),-- sName1
LEFT(CAST(NEWID()ASVARCHAR(36)),RAND()* 60),-- sName2
LEFT(CAST(NEWID()ASVARCHAR(36)),RAND()* 70),-- sName2
LEFT(CAST(NEWID()ASVARCHAR(36)), 2),-- sIdentifier
NULL,            -- dDOB is NULL
(RAND()* 1000 ),-- nWage
SUBSTRING(CAST(NEWID()ASVARCHAR(36)), 6, 7)-- sLicense
)
GO 1000

Create indexes and another small table:
CREATETABLE[dbo].[tblSmall](
                [sIdentifier][char](100)NOTNULL,
                [nCount][int]NULL)
GO

INSERTINTOtblSmallSELECTsIdentifier,COUNT(*)ASnCount
FROMtblLargeWHEREsIdentifierISNOTNULL 
GROUPBYsIdentifier
GO

ALTERTABLE[tblLarge]
ADD  CONSTRAINT[PK_tblLarge]
PRIMARYKEYCLUSTERED ([xID]ASC)

CREATENONCLUSTEREDINDEX[IX_dDOB]
ON[tblLarge]([dDOB]ASC)
INCLUDE([sIdentifier])

ALTERTABLE[tblSmall]
ADD  CONSTRAINT[PK_tblSmall]
PRIMARYKEYCLUSTERED ([sIdentifier]ASC)
GO

Script to create Stored Procedure:
We will create two Stored Procedures; one with “SET ANSI_NULLS” on and another with off.

-- stored procedure with "ANSI_NULLS ON"
SETANSI_NULLSON
GO
SETQUOTED_IDENTIFIERON
GO

CREATEPROC[dbo].[usp_ANSI_on]
    @dDOBASDATETIME,
    @sIdentifierASCHAR(100)
AS
    BEGIN
        SELECT  b.xID,
                b.sIdentifier,
                b.dDOB,
                a.nCount
        FROM    tblSmalla
                LEFTJOINtblLargebONa.sIdentifier=b.sIdentifier
        WHERE   a.sIdentifier=@sIdentifier
                ANDb.dDOB=@dDOB
    END
GO


-- stored procedure with "ANSI_NULLS OFF"
SETANSI_NULLSOFF
GO
SETQUOTED_IDENTIFIERON
GO

CREATEPROC[dbo].[usp_ANSI_off]
    @dDOBASDATETIME,
    @sIdentifierASCHAR(100)
AS
    BEGIN
        SELECT  b.xID,
                b.sIdentifier,
                b.dDOB,
                a.nCount
        FROM    tblSmalla
                LEFTJOINtblLargebONa.sIdentifier=b.sIdentifier
        WHERE   a.sIdentifier=@sIdentifier
                ANDb.dDOB=@dDOB
    END
GO


Executing two Stored Procedures:
From a new query window, run the two stored procedures and capture the actual execution plan. The following is my output from my test.

Figure# 1:Comparing the execution plans.


From the above actual execution plan, it seems that we need to create an index. So let’s create the missing index. Execute both SPs again.

CREATENONCLUSTEREDINDEX[IX_sIdentifier]
ON[tblLarge](  [sIdentifier]ASC)
INCLUDE(dDOB)


Figure# 2:Comparing the execution plans after creating the index.


Review and Analysis:
SQL Server now stopped asking to create missing indexes, but unfortunately it is still using a simillar execution plan with a "SORT Operator" even after clearing the cache.

1.      So, it makes sense that “ANSI_NULLS” has an effect on the execution plan.
2.      “ANSI_NULLS OFF” cannot use index even though the appropriate index is there.
3.      CPU and overall query cost will be high as it has to scan or seek all “NULL” values for further processes.

Resolving the issue:
To resolve the costing issue and to improve its performance, we can perform the following two options:

1.      Create or modify Stored Procedures with “SET ANSI_NULLS ON”.
2.      Rewrite the query; in our case we can move the “dDOB” after the “JOIN” clause. This will work regardless of the “ANSI_NULLS” setting.

CREATEPROC[dbo].[usp_ANSI_off_optimize]
    @dDOBASDATETIME,
    @sIdentifierASCHAR(100)
AS
    BEGIN
        SELECT  b.xID,
                b.sIdentifier,
                b.dDOB,
                a.nCount
        FROM    tblSmalla
                LEFTJOINtblLargebONa.sIdentifier=b.sIdentifier
                                        ANDb.dDOB=@dDOB
        WHERE   a.sIdentifier=@sIdentifier
    END
GO

--Using JOIN
CREATEPROC[dbo].[usp_ANSI_off_optimize_JOIN]
       @dDOBASDATETIME,
       @sIdentifierASCHAR(100)
AS
       BEGIN
              SELECTb.xID,
                    b.sIdentifier,
                    b.dDOB,
                    a.nCount
             FROM   tblSmalla
                    JOINtblLargebONa.sIdentifier=b.sIdentifier
                                       ANDb.dDOB=@dDOB
             WHERE  a.sIdentifier=@sIdentifier
        END
 GO


Query to Identify “ANSI_NULLS” setting:
To identify where “ANSI_NULLS” ( as well “QUOTED_IDENTIFIER”) were used when Stored Procedures were created, the following query can be used.

/*******************************************
** Following two settings must be ON
** SET ANSI_NULLS ON
** SET QUOTED_IDENTIFIER ON
*******************************************/
SELECT  SCHEMA_NAME(s.schema_id)+'.'+s.nameASname,
        s.create_date,
        s.modify_date,
        (CASEWHENOBJECTPROPERTY(s.object_id,'ExecIsQuotedIdentOn')= 1 THEN'ON'
               ELSE'OFF'
          END)AS'Setting of QUOTED_IDENTIFIER at creation time',
        (CASEWHENOBJECTPROPERTY(s.object_id,'ExecIsAnsiNullsOn')= 1 THEN'ON'
               ELSE'OFF'
          END)AS'Setting of ANSI_NULLS at creation time'
FROM    sys.objectss
WHERE   s.typeIN('P','TR','V','IF','FN','TF')
        ANDOBJECTPROPERTY(s.object_id,'ExecIsQuotedIdentOn')= 0
        ANDOBJECTPROPERTY(s.object_id,'ExecIsAnsiNullsOn')= 0
ORDERBYs.nameASC

References:
SET ANSI_NULLS (Transact-SQL)
http://msdn.microsoft.com/en-CA/library/ms188048.aspx

OBJECTPROPERTY (Transact-SQL)
http://msdn.microsoft.com/en-us/library/ms176105.aspx

Slow in the Application, Fast in SSMS? Understanding Performance Mysteries.
http://www.sommarskog.se/query-plan-mysteries.html

Realtime SQL Server Performance Monitoring - A simple way to see SQL Server performance metrics

$
0
0
Background of the tool:
“SQL Performance Monitor”. It is completely Free, Agent less,  No Installation/Configuration is required, Single executable and portable, easy to use and only needs a couple of clicks to be up and running. As database administrators, we have to support different SQL Server environments. Often it becomes a challenge and obvious to understand the current server health status. To attain this goal based on my requirements, I have created a small tool "SQL Monitor".


Download Link:
SQL Performance Monitor - v2.2 
Last Update :   28 November 2013
        ** Automated SQL Blocking check
Download Link: http://bit.ly/18jpyg6

Agreement:
This is a non-commercial, educational and learning purpose tool. It is not an alternative for any commercial grade application. This tool is efficient and sharp like a blade; however, I will not able to provide any warranty, guarantee or accuracy of this tool. Although it is a lightweight data collection and visualization tool, it should not cause any performance issues, however you should test it yourself before running it against any database server.

Figure ground zero: Main dashboard of SQL Performance Monitor


Figure: Waititype Monitor and Analysis in real-time


A challenge:
Retrieving and visualizing the SQL Server performance data is always a challenge and a tedious task for SQL Server database professionals. Utilizing the Windows PerfMon application is the easiest way to perform this task as well as querying “sys.dm_os_performance_counters” and some other DMVs brings a lot of useful information.

Starting from SQL Server 2005, Microsoft has introduced DMV to query various internal metadata directly to explore various health status data. Although collecting and analyzing SQL Server performance data in a regular basis provides trending ability, monitoring real-time performance data is critical to understand an ongoing performance condition that is occurring.

We are all familiar with built-in “SQL Server Activity Monitor” and obviously it is a good starting point to troubleshoot some SQL Server issues. However, the capacity of this tool is limited as it does not provide other performance metrics which are important to understand the server health status. To extend this idea especially during a performance condition, I have attempted to develop a “SQL Performance Monitor” desktop app by including some other interesting metrics which I believe might be helpful to troubleshoot or understand a problem.

This tool collects more than 50+ performance data directly from SQL Server in real-time and shows data in the chart continuously. Also, it does not require any installation and configuration.

Data collection:
SQL Scripts used in my tool are excerpted from SSMS and some are collected from various forums which are freely available. My understanding is that all the scripts that I have used are reliable however if any are not working, please let me know and I will attempt to fix the issue.

How does it work?
1.           Has the ability to monitor only a single SQL instance at a time and can be used against all editions of SQL Server from 2005 to SQL 2012
2.           Charts and grids will be populated with collected performance data every 5 seconds by default (can be changed) for every 5 minutes (can be changed) moving forward.
3.           Performance data will be saved automatically as they are collected in a SQLite database (sqlmonitor.db3).
4.           All saved performance data can be queried, and then can be exported as a CSV format. As “sqlmonitor.db3” is not protected therefore it can be opened with any SQLite tool.

Limitations:
1.           It has no notification system, such as email, alert, popup.
2.           It is a desktop 32-bit application, cannot run as a service.
3.           Chart colors have no special meaning.

Known Limitations:
(a)       SQL 2005 – in the “Server Info” tab the “Available Memory” will be zero.
(b)       CPU utilization has been calculated from “Resource Pool” and @@CPU_BUSY. Due to the internal limitation of SQL Server, and feature limitation of Standard and Express editions, CPU value may show zero on the chart. In Enterprise edition, CPU utilization will not be zero.

How to run:
(a)   Create a folder.
(b)   Download the “SQLMonitor.exe” in that folder.
(c)    Run the executable “SQLMonitor.exe”– that’s it.
(d)   There is no extra configuration or components required to run this tool.

Connect to a database server:
The tool bar of “SQL Performance Monitor”

Figure#1: Tool bar of SQL Activity Monitor

First time connection:
To connect a SQL Server instance, click the “SQL Server to Monitor” button. Supply the required information and then click “Try Connect” in the connection dialog box. Once connected, close the connection dialog box or choose another server to connect to.

All charts will be populated for an hour with blank data once a connection is made. It continues to collect and display data based on the duration configured on the tool bar. All collected data will be saved in a SQLite database (sqlmonitor.db) for later review and analysis.

Using a saved connection:
A successful connection can be saved for later use. Once the tool successfully connects to a database server, click the “save connection” button to save the connection string. An encoded text file will be created in the same folder with the “.txt” extension where the “SQLMonitor.exe” resides.

From the bottom list box of the “SQL Server Connection” (figure#2) dialog box, double click a previously saved file to connect to a SQL Server instance.

Couple of Screenshots from “SQL Performance Monitor”

Figure#2: SQL Server Connection dialog

Figure#3A: Viewing all running sessions

Figure#3B: Viewing all sessions

Historical data:
In the history tab, put “SQL Instance Name” and “date” to query historical data. Click any column header to view data in the chart. All data and charts can be saved.

Figure#4: Historical data browse


Figure#5: Summarizing historical data


Summary:
I use this tool on a regular basis and I hope someone may find it useful too. I will continue to add more features, so if you like it - check back often for updates.

WRITELOG waittype - Implicit vs. Explicit Transaction: disk or coding issue?

$
0
0
In a OLTP system where concurrency is high observing WRITELOG waittype is normal for a short period of time during peak usage. Generally, a high value of this waittype indicates slow response of the application. So, observing this waittype for a longer period of time and repeatedly for DML operations such as MERGE, INSERT, UPDATE and DELETE, obviously this indicates two specific issues:

1.      Disk I/O sub-system
2.      Transaction handing

If the underlying disk sub-system is the best in the industry and configured correctly, investigation shows nothing suspicious around I/O and if we still see the WRITELOG waittype then it is obviously the result of poor or improper handling of Transactions in a SQL batch.

Figure #1: WRITELOG waittype in a live system
Let’s explain what WRITELOG waittype is. This is a log management system waiting for dirty data pages to write on the disk. This waittype indicates that the SPID is waiting for a transaction log I/O request to be completed.  Thus if the number of WRITELOG waittype is high that means there are a number of requests in the queue which are processing slowly. Although, many experts and even MS KB article (KB822101) indicates it is a disk bottleneck, in reality this may not be the case unless your disk system is IDE or SATA based or configured incorrectly. We need to investigate one more area before confirming that the disk is an issue.

Implicit and explicit transaction:
As the WRITELOG waittype is related to the transaction log management system, let’s try to understand the difference between the two.

SQL Server handles two types of transaction mode:
(a)   Implicit transaction
(b)   Explicit transaction

Implicit transaction: In Implicit transaction mode, the instance of the SQL Server Database Engine automatically starts a new transaction after the current transaction is committed or rolled back for each DML statement. We do not need to define the start of a transaction; each statement level transaction will be committed or rolled back automatically.

Implicit transaction can be turned on or off per batch basis. We can use the “SET IMPLICIT_TRANSACTIONS ON/OFF” statement to turn implicit transaction mode off. We can use the “COMMIT TRANSACTION” or “ROLLBACK TRANSACTION” statements to end each transaction.

Explicit transaction: An explicit transaction is one in which we explicitly define both the starting and ending of the transaction. To start an explicit transaction, we can use “BEGIN TRANSACTION” and then complete the transaction by using “COMMIT TRANSACTION” or “ROLLBACK TRANSACTION”.

The main difference between Implicit and Explicit transaction is that implicit transaction is auto, controlled by SQL Server Engine and statement level transaction, whereas explicit transaction is user defined and batch-scoped transaction. Some key comparisons are follows:

Indicator
Implicit Transaction
Explicit Transaction
Scope
Statement level
Batch level
Log generation
continuous chain of transactions
One transaction log entry
Log I/O
For each statement gets one I/O
Entire batch needs one I/O
WRITELOG Waittype
Sustained period of time
N/A or unless there is real disk issue
Response/duration
Longer due to several I/O activities
Fast, less I/O activities
T-Log Restore
Long, Redo/undo phase
Short redo/undo phase
Impact on T-Log
Extremely high
Less and insignificant
Write Duration
Longer and slow
Shorter and fast


The application which is utilizing the Implicit Transaction mechanism actually makes the I/O system busy and degrades application response time dramatically. As a result, various disk related performance counters show significantly high values and we start believing that the disk is the bottleneck.

Observing the WRITLOG waittype:
In the following test we will review how implicit and explicit transaction incurs WRITELOG waittype. The given script can be executed in any version of SQL Server and with any kind of disk system to understand the behavior.

Complete T-SQL Code to produce the behavior:
/******************************************************
** Implicit vs Explicit Transaction
** Author: Sarjen Haque
** Apply to: SQL 2005 to 2012
******************************************************/
DBCCSQLPERF('sys.dm_os_wait_stats',CLEAR);

IFOBJECT_ID('tempdb..#wait')ISNOTNULL
   DROPTABLE#wait
GO

/*************************************
** Create a test database
*************************************/
USE[master]
GO
IFEXISTS(SELECT  name
            FROM    sys.databases
            WHERE   name=N'TestDB')
   BEGIN
         ALTERDATABASE[TestDB]SET  SINGLE_USERWITHROLLBACKIMMEDIATE
         DROPDATABASE[TestDB]
   END
GO

CREATEDATABASETestDB
GO

USETestDB
GO
/*************************************
** Create a a table
*************************************/
SETNOCOUNTON
IFOBJECT_ID('tblLarge')ISNOTNULL
   DROPTABLEtblLarge
GO

CREATETABLEtblLarge
       (
         xIDINTIDENTITY(1, 1),
         sName1VARCHAR(100),
         sName2VARCHAR(1000),
         sName3VARCHAR(400),
         sIdentifierCHAR(100),
         dDOBDATETIMENULL,
         nWageNUMERIC(20, 2),
         sLicenseVARCHAR(25)
       )
GO
/*************************************
** Perform a checkpoint
*************************************/
CHECKPOINT


/*************************************
** Collect initial wait stats
*************************************/
SELECT  'w1'WaitRun,
        wait_type,
        wait_time_ms/ 1000.0 ASWaitSec,
        (wait_time_ms-signal_wait_time_ms)/ 1000.0 ASResourceSec,
        signal_wait_time_ms/ 1000.0 ASSignalSec,
        waiting_tasks_countASWaitCount
INTO    #Wait
FROM    sys.dm_os_wait_stats
WHERE   wait_typeLIKE'WRITELOG%'

GO
/*************************************
** Using explicit Transaction
*************************************/
SETNOCOUNTON
USETestDB
GO

DECLARE@nINT
SET@n=1

BEGINTRANSACTION
WHILE@n<= 10000
      BEGIN
            INSERT  INTOtblLarge
                    (sName1,
                      sName2,
                      sName3,
                      sIdentifier,
                      dDOB,
                      nWage,
                      sLicense
                    )
            VALUES  (LEFT(CAST(NEWID()ASVARCHAR(36)),RAND()* 50),    -- sName1
                      LEFT(CAST(NEWID()ASVARCHAR(36)),RAND()* 60),    -- sName2
                      LEFT(CAST(NEWID()ASVARCHAR(36)),RAND()* 70),    -- sName2
                      LEFT(CAST(NEWID()ASVARCHAR(36)), 2),              -- sIdentifier    
                      DATEADD(dd,-RAND()* 20000,GETDATE()),            -- dDOB
                      (RAND()* 1000 ),                                  -- nWage
                      SUBSTRING(CAST(NEWID()ASVARCHAR(36)), 6, 7)        -- sLicense       
                    )
            SET@n=@n+ 1
      END
COMMITTRANSACTION

GO
/***************************************
** Collect wait stats for Explicit TRN
***************************************/
INSERT  INTO#wait
        SELECT  'w2'WaitRun,
                wait_type,
                wait_time_ms/ 1000.0 ASWaitSec,
                (wait_time_ms-signal_wait_time_ms)/ 1000.0 ASResourceSec,
                signal_wait_time_ms/ 1000.0 ASSignalSec,
                waiting_tasks_countASWaitCount
        FROM    sys.dm_os_wait_stats
        WHERE   wait_typeLIKE'WRITELOG%'
GO
/*****************************************
** Check for Log flush for Explicit TRN
*****************************************/
SELECT  'Explicit'ASTransaction_Type,
        SPID,
        Operation,
        COUNT(Operation)[OperationCount],
        [Transaction Name],
        COUNT([Transaction Name])AS[TransactionNameCount]
FROM    ::
        fn_dblog(NULL,NULL)
WHERE   operationLIKE'%LOP_BEGIN_XACT%'
        AND[SPID]=@@spid
        AND[SPID]ISNOTNULL
GROUPBYSPID,
        Operation,
        [Transaction Name]
GO

/************************************
** Using implicit Transaction
************************************/
SETNOCOUNTON
USETestDB
GO

DECLARE@nINT
SET@n=1

WHILE@n<= 10000
      BEGIN
            INSERT  INTOtblLarge
                    (sName1,
                      sName2,
                      sName3,
                      sIdentifier,
                      dDOB,
                      nWage,
                      sLicense
                    )
            VALUES  (LEFT(CAST(NEWID()ASVARCHAR(36)),RAND()* 50),    -- sName1
                      LEFT(CAST(NEWID()ASVARCHAR(36)),RAND()* 60),    -- sName2
                      LEFT(CAST(NEWID()ASVARCHAR(36)),RAND()* 70),    -- sName2
                      LEFT(CAST(NEWID()ASVARCHAR(36)), 2),              -- sIdentifier    
                      DATEADD(dd,-RAND()* 20000,GETDATE()),            -- dDOB
                      (RAND()* 1000 ),                                  -- nWage
                      SUBSTRING(CAST(NEWID()ASVARCHAR(36)), 6, 7)        -- sLicense       
                    )
            SET@n=@n+ 1
      END

GO
/***************************************
** Collect wait stats for Implicit TRN
***************************************/
INSERT  INTO#wait
        SELECT  'w3'WaitRun,
                wait_type,
                wait_time_ms/ 1000.0 ASWaitSec,
                (wait_time_ms-signal_wait_time_ms)/ 1000.0 ASResourceSec,
                signal_wait_time_ms/ 1000.0 ASSignalSec,
                waiting_tasks_countASWaitCount
        FROM    sys.dm_os_wait_stats
        WHERE   wait_typeLIKE'WRITELOG%'
GO

/************************************
** Check for Log flush
************************************/
SELECT  'Implicit'ASTransaction_Type,
        SPID,
        Operation,
        COUNT(Operation)[OperationCount],
        [Transaction Name],
        COUNT([Transaction Name])AS[TransactionNameCount]
FROM    ::
        fn_dblog(NULL,NULL)
WHERE   operationLIKE'%LOP_BEGIN_XACT%'
        AND[SPID]=@@spid
        AND[SPID]ISNOTNULL
GROUPBYSPID,
        Operation,
        [Transaction Name]
     
GO

/********************************************************
** Compare the waittype collection
********************************************************/
SELECT  a.wait_type,
        'Explicit Transaction'ASTransaction_Type,
        (b.WaitSec-a.WaitSec)ASTotalwaitSec,
        (b.ResourceSec-a.ResourceSec)ASTotalResourceSec,
        (b.SignalSec-a.SignalSec)ASTotalSignalSec,
        (b.WaitCount-a.WaitCount)ASTotalWaitCount
FROM    (SELECT    *
          FROM      #wait
          WHERE     waitrun='w1'
        )a
        JOIN(SELECT   *
               FROM     #wait
               WHERE    waitrun='w2'
             )bONa.wait_type=b.wait_type
UNIONALL
SELECT  a.wait_type,
        'Implicit Transaction'ASTransaction_Type,
        (b.WaitSec-a.WaitSec)ASTotalwaitSec,
        (b.ResourceSec-a.ResourceSec)ASTotalResourceSec,
        (b.SignalSec-a.SignalSec)ASTotalSignalSec,
        (b.WaitCount-a.WaitCount)ASTotalWaitCount
FROM    (SELECT    *
          FROM      #wait
          WHERE     waitrun='w2'
        )a
        JOIN(SELECT   *
               FROM     #wait
               WHERE    waitrun='w3'
             )bONa.wait_type=b.wait_type

GO

Figure #2: implicit vs. explicit

Figure #2: implicit vs. explicit

Figure #3: implicit vs. explicit 

 
Analysis:
The analysis is simple and easy to understand from the output. From the above pictures we can see that the implicit transaction is always slow, signal wait is high and requires more I/O activities to complete a task.

Summary:
We saw that WRITELOG waittype does not necessarily indicate a disk throughput problem. It is the SQL Server Transaction Log management system who is doing more work to write each transaction into the log file. So before concluding, I would recommend to review your application code and see if you can use explicit transactions. I am sure that even though you use an Enterprise Class SSD system, implicit transaction may not improve the application performance dramatically.

MAXDOP - What triggers Parallelism?

$
0
0
Charles Darwin was an English naturalist. He established that all species of life have descended over time from common ancestors and proposed the scientific theory that this branching pattern of evolution resulted from a process that he called natural selection. I am sure that everybody knows this theory and it is well accepted.

How does the above analogy works with SQL Server Query Optimizer? Query Optimizer of SQL Server obeys Charles Darwin theory while creating an execution plan before executing the SQL Query. SQL Server query optimizer is a cost based optimizer, what it means is that before creating an execution plan it considers a number of facts and factors to produce a trivial and “good enough” plan. In the following short list, we can identify those:

1.      Construction of the query.
2.      Number of records, data length, and size of the table.
3.      Appropriate indexes and up-to-date statistics.
4.      I/O, CPU and Memory.

MAXDOP in OLTP:
In an OLTP environment, it is expectable that all queries and transactions are efficient and quick enough to finish its execution within 5 seconds. If it does not then SQL Server will take advantage of parallelism based on the query cost and MAXDOP setting.

There are a vast number of considerations, recommendations and concerns as well as what will be the settings of MAXDOP in OLTP environment? In OLTP implementation, it is expected that all queries have been written with performance in mind while adhering to the best practices. But in the real world this is not the case. Some queries are written poorly or are performing poorly because of the lack of appropriate indexes, out dated statistics, memory pressure, CPU bottleneck, slow I/O response, and so on.  

How MAXDOP works?
MAXDOP is the maximum number of worker threads SQL Server Query Optimizer can use to execute a query. Each thread will go to each processor’s core during an execution of a parallel query. The MAXDOP = 0 (zero) means that the Query Optimizer is flexible to use the required number of threads to execute the query based on a set of predefined rules and a mechanism built-in in SQL Server.  

Besides the server wide settings, Query hint (OPTION (MAXDOP n)) can be used to control parallel execution of a query. “Cost threshold for parallelism” is another server wide setting that can be utilized to control parallelism behavior. 

"At execution time, if parallel execution is warranted, the Database Engine determines the optimal number of threads and spreads the execution of the parallel plan across those threads in its each execution. When a query or index operation starts executing on multiple threads for parallel execution, the same number of threads is used until the operation is completed. The Database Engine re-examines the optimal number of thread decisions every time an execution plan is retrieved from the plan cache. For example, one execution of a query can result in the use of a serial plan, a later execution of the same query can result in a parallel plan using three threads, and a third execution can result in a parallel plan using four threads".

What triggers Parallelism?
There are a couple different and specific reasons in OLTP system that triggers SQL Server to choose parallel execution of query to speedup data retrieval process. The following are a couple of important key factors for which SQL Server database engine chooses parallel query execution. 

1.      The query contains ORDER BY or GROUP BY clause. This means excessive sort operation. There are no appropriate indexes to support the sort operation.
2.      Skewed data; meaning a column contains substantial number of duplicate records.
3.      Memory grant is in-sufficient to execute the query. All sort operation requires extra memory and thus causes a “spill to tempdb”.
4.      Not updated distribution statistics.
5.      Processing huge number of records.

Symptoms and detecting Parallelism Issue:
Usually CXPACKET waittype can be used to monitor parallel query execution behavior in OLTP systems. But keep in mind that CXPACKET does not necessarily indicate that parallelism is an issue. This wait means that the parent thread is waiting to synchronize all output from the child threads. However, if you see SQL blocking on CXPACKET, it indicates that the SQL Server is facing resource contention such as lack of indexes, out-dated statistics, I/O and CPU bottleneck, parameter sniffing issue, excessive sort operation and so on.

Generally and as per SSMS implementation, the combined waits from EXCHANGE, EXECSYNC and CXPACKET can be used to measure and identify whether parallelism is an issue or not.  

By increasing MAXDOP, if you see that the CPU usages goes high and the number of waiting tasks increases, this generally indicates that there is a parallelism issue. “Avg waiting tasks” in “Activity Monitor” can be used to observe the behavior quickly. Following simple queries are also good to observe the parallel threading behavior

SELECT  SUM(s.runnable_tasks_count)
FROM    sys.dm_os_schedulerss
WHERE   s.[scheduler_id]< 255

SELECT  wait_type,
        waiting_tasks_count,
        (wait_time_ms-signal_wait_time_ms)ASresource_wait_time_ms
FROM    sys.dm_os_wait_stats
WHERE   wait_typeIN('EXCHANGE','EXECSYNC','CXPACKET')
ORDERBYresource_wait_time_msDESC

You can also use my simple monitoring tool to detect and visualize parallelism issues. Please note that the excerpted scripts from SSMS were used to build this section.


Recommendations:
In OLTP systems using MAXDOP, value 1 is recommended by Microsoft and all the industry experts. However some queries will be benefited from higher value if you are not able to tune your queries, unable to create/update appropriate indexes or statistics. If you notice a fewer number of “Worker Threads” then MAXDOP =1 is more suitable and based on the workload it can be increased slowly.  

Reference:
Degree of Parallelism
http://msdn.microsoft.com/en-us/library/ms188611(v=sql.105).aspx

Understanding and Controlling Parallel Query Processing in SQL Server
http://msdn.microsoft.com/en-us/library/gg415714.aspx

Performance issues from ORDER BY/GROUP BY - spills in tempdb

$
0
0
It is very common and expected to see a query containing ORDER BY or GROUP BY clause for displaying or grouping purposes. It is also common that developers use ORDER BY clause from a habit without considering its necessity. As a result, queries become slower overtime as the number of records increases.


The Last Supper - by Leonardo da Vinci
Grouping example in Art 
When a sort operation unable to acquire sufficient memory grant and it cannot be done in the memory and must happen in the tempdb. The heavier processing load inside the tempdb degrades overall SQL Server performance significantly. This situation is usually known as “spill to tempdb” or “spills in tempdb”. It is crucial to identify those sort warnings and avoid them whenever possible.

In my experience, I have seen ORDER BY/GROUP BY being used on a VARCHAR (8000) column while retrieving data; even unwisely used on a JOIN clause! Tweaking these queries is a bit tricky and most of the time it is impossible since the front-end application or business logic has already been built-in on this criterion. Creating an index on this column is not possible due to the 900 bytes restriction on an index key column.  So, other than crossing fingers, there is nothing much to do to resolve the performance issue immediately.  

Common Issues:
Following are some common issues that occur due to the misuse of ORDER BY/GROUP BY clause:
1.      Rapid tempdb data file growth.
2.      Increases disk I/O activities on tempdb and tempdb drive.
3.      Introduces lock contention and escalation.
4.      Increases memory grant for sort/hash operation.
5.      Introduces parallel query plan.

Detecting the Issue:
Detecting performance issues that arise from sort operation is quite simple and straight forward. Following are some tips to identify issues:
1.      Review the query and identify columns that are used on ORDER/GROUP clauses.
2.      Review the Execution plan and identify “sort” operators.
3.      Identify parallelism operators that perform the “distribute streams”, ”gather streams” and “repartition streams” in parallel execution plan.
4.      Use SQL Profiler Trace event “sort warnings”.
5.      Extended Event – “sort_warning”
6.      Use PerfMom or sys.dm_os_performance to track “worktables created/sec” and “workfiles created/sec”

To resolve the performance Issue:
To resolve performance issues that occur from a sort operation, a couple of actions can be taken as follows:
1.        Review the necessity of a sort operation in the query.
2.        Try to perform a sort operation in the front-end.
3.        Normalize the database schema.
4.        Create single or multi-column indexes.
5.        Apply filters on indexes.
6.        Use TOP (n) when there is an “ORDER BY”, if possible.
7.        Put more filters in the query to touch less data.
8.        Update distribution statistics.

Observing the behavior:
To observe the common issues with ORDER BY/GROUP BY operations, let’s create a database, table and a simple select statement against 500,000 records.

CREATEDATABASEtestDB
GO
USEtestDB
GO

SETNOCOUNTON

IFOBJECT_ID('tblLarge')ISNOTNULL
    DROPTABLEtblLarge
GO

CREATETABLEtblLarge
    (
      xIDINTIDENTITY(1, 1),
      sName1VARCHAR(100),
      sName2VARCHAR(1000),
      sName3VARCHAR(400),
      sIdentifierCHAR(100),
      dDOBDATETIMENULL,
      nWageNUMERIC(20, 2),
      sLicenseVARCHAR(25)
    )
GO

/*********************************
Add 500000 records
**********************************/

SETNOCOUNTON
INSERT  INTOtblLarge
        (sName1,
          sName2,
          sName3,
          sIdentifier,
          dDOB,
          nWage,
          sLicense
        )
VALUES  (LEFT(CAST(NEWID()ASVARCHAR(36)),RAND()* 50),    -- sName1
          LEFT(CAST(NEWID()ASVARCHAR(36)),RAND()* 60),    -- sName2
          LEFT(CAST(NEWID()ASVARCHAR(36)),RAND()* 70),    -- sName2
          LEFT(CAST(NEWID()ASVARCHAR(36)), 2),              -- sIdentifier    
          DATEADD(dd,-RAND()* 20000,GETDATE()),            -- dDOB
          (RAND()* 1000 ),                                  -- nWage
          SUBSTRING(CAST(NEWID()ASVARCHAR(36)), 6, 7)        -- sLicense       
        )
GO 500000

/******************************************************
** Create a clustered index
******************************************************/
ALTERTABLE[tblLarge]
       ADD  CONSTRAINT[PK_tblLarge]
       PRIMARYKEYCLUSTERED ([xID]ASC)

/***************************************************************
** To resolve the sort warning, create a non-clustered index
***************************************************************/
CREATENONCLUSTEREDINDEX[IX_sName1]
       ON[tblLarge]([sName1]ASC)


Simple SELECT Statement:
Following are some simple select statements to reproduce the behavior.

/******************************************************
** Simple select statement
******************************************************/
--First query
SELECT  xID,
        sName1
FROM    tblLarge

-- Second query with - ORDER BY
SELECT  xID,
        sName1
FROM    tblLarge
ORDERBYsName1

-- Third query - GROUP BY/ORDER BY
SELECT  sName1,
        COUNT(sName1)ASnCount
FROM    tblLargea
GROUPBYsName1
ORDERBYsName1

Using Extended Events (SQL 2012), SQL Profiler Trace and Execution Plan, “sort warning” are easily detectable and following are some outputs.

Figure#1: sort warning using Extended Events in SQL 2012


Figure#2A: sort warning detection using Execution Plan


Figure#2B: sort warning detection using Execution Plan

  
Figure#2: sort warning detection using SQL Profiler Trace


Learn More:

Execution Plan and “SQL Sentry Plan Explorer” – it's like a hand of god!

$
0
0
There are numerous articles that have been written on how out-dated statistics cause severe performance issues. I am hesitant to add one more to that long list. However, this time I’ll be using “SQL Sentry Plan Explorer” to present the issue. Please note that I am not a sales agent or representative of “SQL Sentry”, I wanted to share its simplistic interface and usability. This tool is free, extremely powerful and it brings all the qualities a SQL Server Expert ever needs to analyze an Execution Plan; especially the ones who work on query performance tuning.

Sometime ago, I received a request from a source to help them out on a query performance issue. The issue they were experiencing was that the duration of a business critical query is degrading; and now it takes up to 5 minutes to complete!

I asked them to send me the XML output of the actual execution plan for that query. I opened the received query plan in both “SQL Sentry Plan Explorer” and “SSMS”; and found the root cause almost immediately – which was cardinality estimation issue due to “out-dated statistics”. So the ultimate recommendation was to update statistics. After updating, the query took less than 4 seconds.

Here, I am sharing the outputs from “SQL Sentry Plan Explorer” to show you how intuitive the tool is to understand an execution plan and identify any plan quality problems immediately. Following are a couple of screenshots you may find interesting.

Visit: SQL Sentry Plan Explorer

Some Screenshots:


SQL Server Port - How to open in Windows Firewall

$
0
0
In the IT security world, it is said that approximately 80% of all security breaches occur by insiders; directly or indirectly, willingly or unwillingly. Here our focus is local Windows firewall and to see whether it is correctly configured or not. It is essential to make sure that every Windows and SQL Server is secured and protected.

Although SQL Server resides inside a DMZ, it is still important to secure the SQL box for anything unforeseen and there is no reason to disable the windows firewall. By opening a couple of TCP or UDP ports without disabling the Windows Firewall will guarantee maximum protection of a SQL Box. 

In the following steps, we will configure Windows Firewall for the default port 1433 to allow traffic to pass through in Windows 2012 for SQL Server 2012.

Step by step guide:
1.      In “Server Manager” select “Local Server”. (figure # 1)
2.      From the “Tool” menu select “Windows Firewall with Advanced Security”.
3.      Select the “Inbound Rules” from the left hand side. From the Action pane select “New Rule”. (figure # 2)
4.      On the rule type dialog box, select “Port” and click next. (figure # 3)
5.      Select “TCP” and enter 1433 in the “Specific Local Ports” box. (figure # 4)
6.      On the next dialog box, select “Allow the connection”. (figure # 5)
7.      On the profile dialog box, select all three options: “Domain”, “Private” and “Public”. (figure # 6)
8.      On the last dialog box provide a name, e.g. “SQL Server Database Engine” and description. Then click finish button. (figure # 7)
9.      On the “Windows Firewall with Advanced Security”, click “Enable rule”. (figure # 8)

Figure # 1:Windows Firewall configuration for SQL Server Port 1433

Figure # 2:Windows Firewall configuration for SQL Server Port 1433

Figure # 3:Windows Firewall configuration for SQL Server Port 1433

Figure # 4:Windows Firewall configuration for SQL Server Port 1433

Figure # 5:Windows Firewall configuration for SQL Server Port 1433

Figure # 6:Windows Firewall configuration for SQL Server Port 1433

Figure # 7:Windows Firewall configuration for SQL Server Port 1433

Figure # 8:Windows Firewall configuration for SQL Server Port 1433

Self-join incurs more I/O activities and increases locking overhead!

$
0
0
The Self-Join technique is commonly used to create a hierarchical tree set or finding duplicate records. It is also used to find previous or next values from a table by utilizing the inline table technique. Generally aself-join is a join in which a table is joined with itself. For example, when we need details about an employee and his manager where both employee and manager ID resides in the same table.

When we use self-join, it usually indicates that the table is not normalized. This may not be a problem for a small table but for a large and busy OLTP table with higher concurrency, this may lead to poor performance and degrade query response time.

The key point is that each self-joined table will be treated as a separate table while retrieving data from the disk, thus self-join incurs more I/O activities and increases locking overhead as it touches the same table twice or more. By adding appropriate indexes on JOIN and WHERE clause columns, it will reduce I/O activities and improve performance. It will be a good approach to avoid self-join whenever possible for heavy duty OLTP tables and queries.

Let’s perform a simple self-join test to see how the execution plan looks like. We can observe that as the retrieval number of records increases, each query behaves differently, such as requiring specific index and introducing parallel query.

Queries:
-- self-join one
selecttop (10)  a.xid,a.sIdentifier
from    tbllargea
        innerjointbllargebona.xid=b.xid
where   a.sIdentifier='A1'

-- self-join two
selecttop (100)  a.xid,a.sIdentifier
from    tbllargea
        innerjointbllargebona.xid=b.xid
where   a.sIdentifier='A1'

-- self-join three
selecttop (1000)  a.xid,a.sIdentifier
from    tbllargea
        innerjointbllargebona.xid=b.xid
where   a.sIdentifier='A1'

Execution Plan:

Index optimization - REBUILD vs. REORGANIZE

$
0
0
Index optimization is probably one of the most critical task every database support personnel has to perform on a regular basis. Based on DML operations in a particular environment, we adopt various optimization tasks, steps and strategies that suit our needs. Some tables or indexes may need frequent optimization, some do not need it at all for a longer period of time.

To optimize an index we have two options, REBUILD and REORGANIZE. Both work differently and have different effects. There are some differences which we should be aware of for better understanding of how each T-SQL command works and what does it do for us.

Good to Know some key points:
1.      When a non-clustered index is rebuilt, only the associate statistics for this index will be rebuilt.
2.      Rebuilding a clustered index does not rebuild associated non-clustered indexes unless the keyword ALL is specified.
3.      “HEAP” cannot be optimized. If “ALL” is specified and the underlying table is a heap, the rebuild operation has no effect on the table. Any non-clustered indexes associated with the table are rebuilt.
4.      The rebuild operation can be minimally logged if the database recovery model is set to either bulk-logged or simple.
5.      The options ONLINE = ON and IGNORE_DUP_KEY = ON are not valid while rebuilding an XML index or a spatial index.
6.      “STATISTICS_NORECOMPUTE = ON” means Out-of-date statistics are not automatically recomputed. “STATISTICS_NORECOMPUTE = OFF” means automatic statistic updating is enabled.
7.      If index options are not specified, the existing index option values stored in sys.indexeswill be used.
8.      ALTER INDEX cannot be used to repartition an index or move it to a different filegroup. This statement cannot be used to modify the index definition, such as adding or deleting columns or changing the column order.
9.      The values for ONLINE, MAXDOP, and SORT_IN_TEMPDB are not stored in the system catalog. You need to specify this OPTION in the index rebuild statement.
10.Reorganizing an index is always performed online. The process does not hold locks long term hence it does not block queries or updates that are running.
11.When you execute ALTER INDEX ALL … on a table, only the statistics associated with indexes are updated. Automatic or manual statistics created on the table will not be updated.
12.Index REBUILD can be a Parallel operation. Index REORGANIZE is always serial operation.
13.Rebuilding or reorganizing small indexes (which has 128 or less extents) often does not reduce fragmentation.
14.Reorganizing an index uses minimal system resources and also compacts the index pages.
15.Reorganizing an index does not update associate statistics.

Index Optimization Guideline:
The guideline that Microsoft has provided in the MSDN is a general guideline regardless of any DML operations happening in the database which need to be further reviewed by the database administrator based on his/her workload scenario to establish a better threshold.

The sys.dm_db_index_physical_stats can be used to determine fragmentation levelsin a specific index, in all indexes on a table or indexed view, in all indexes in a database, or in all indexes in all databases. The following table explains three important columns of the system function which need to be researched closely:

Column
Description
avg_fragmentation_in_percent
The percent of logical fragmentation (out-of-order pages in the index).
fragment_count
The number of fragments (physically consecutive leaf pages) in the index.
avg_fragment_size_in_pages
Average number of pages in one fragment in an index.

Action threshold recommended by Microsoft.
avg_fragmentation_in_percent
T-SQL Command
> 5% and < = 30%
ALTER INDEX REORGANIZE
> 30%
ALTER INDEX REBUILD (All Edition)
ALTER INDEX REBUILD WITH (ONLINE = ON) (Enterprise Edition)
Number of Extents > 128
Will be a good candidate for index optimization

The above threshold is a recommendation only. As every environment is different therefore it is a good idea to research the best threshold that will suit your need.

DMV Query:
The following DMV query can be used to pull detail information about indexes.
/*********************************************************************************
Script: Index Fragmentation Status (includes Partitioned Tables/Indexes)
**********************************************************************************/
select  schema_name(o.schema_id)as[schema_name],
        object_name(o.object_id)as[table_name],
        i.nameas[index_name],
        i.type_descas[index_type],
        dmv.page_count,
        dmv.fragment_count,
        round(dmv.avg_fragment_size_in_pages,2, 2)[avg_fragment_size_in_pages],
        round(dmv.avg_fragmentation_in_percent,2, 2)[avg_fragmentation_in_percent],
        casewhendmv.avg_fragmentation_in_percent<=5 then'RELAX'
             whendmv.avg_fragmentation_in_percent<= 30 then'REORGANIZE'
             whendmv.avg_fragmentation_in_percent> 30 then'REBUILD'
        endas[action],
        stats_date(dmv.object_id,i.index_id)asstats_update_date,
        casewhenisnull(ps.function_id, 1)= 1 then'NO'
             else'YES'
        endaspartitioned,
        coalesce(fg.name,fgp.name)as[file_group_name],
        p.partition_numberas[partition_number],
        p.rowsas[partition_rows],
        prv_left.valueas[partition_lower_boundary_value],
        prv_right.valueas[partition_upper_boundary_value],
        casewhenpf.boundary_value_on_right=1 then'RIGHT'
             whenpf.boundary_value_on_right= 0 then'LEFT'
             else'NONE'
        endas[partition_range],
        pf.nameas[partition_function],
        ds.nameas[partition_scheme]
from    sys.partitionsaspwith (readpast)
        innerjoinsys.indexesasiwith (readpast)oni.object_id=p.object_id
                                                         andi.index_id=p.index_id
        innerjoinsys.objectsasowith (readpast)ono.object_id=i.object_id
        innerjoinsys.dm_db_index_physical_stats(db_id(),null,null,null,
                                                  N'LIMITED')dmvondmv.OBJECT_ID=i.object_id
                                                              anddmv.index_id=i.index_id
                                                              anddmv.partition_number=p.partition_number
        leftjoinsys.data_spacesasdswith (readpast)onds.data_space_id=i.data_space_id
        leftjoinsys.partition_schemesaspswith (readpast)onps.data_space_id=ds.data_space_id
        leftjoinsys.partition_functionsaspfwith (readpast)onpf.function_id=ps.function_id
        leftjoinsys.destination_data_spacesasddswith (readpast)ondds.partition_scheme_id=ps.data_space_id
                                                              anddds.destination_id=p.partition_number
        leftjoinsys.filegroupsasfgwith (readpast)onfg.data_space_id=i.data_space_id
        leftjoinsys.filegroupsasfgpwith (readpast)onfgp.data_space_id=dds.data_space_id
        leftjoinsys.partition_range_valuesasprv_leftwith (readpast)onps.function_id=prv_left.function_id
                                                              andprv_left.boundary_id=p.partition_number
                                                              - 1
        leftjoinsys.partition_range_valuesasprv_rightwith (readpast)onps.function_id=prv_right.function_id
                                                              andprv_right.boundary_id=p.partition_number
where   objectproperty(p.object_id,'ISMSShipped')= 0
orderby[avg_fragmentation_in_percent]DESC,
        [table_name],
        [index_name]

Output of the above script:

Good practice:
1.      Try not to DROP an index beforehand and re-create it again. Use ALTER INDEX WITH REBUILD.
2.      To change the index definition, use CREATE INDEX with the DROP_EXISTING clause to perform the operations.
3.      Be careful about “ALL” option.  When “ALL” is specified, all indexes on the table are dropped and rebuilt in a single transaction; Transaction Log will grow rapidly.
4.      Rebuilding indexes ONLINE might need longer time and you still see short duration blocking.
5.      Always choose off-peak hours to optimize indexes and try to use MAXDOP to take advantage of parallel index creation.

Index Optimization Script:
There are a number of automated index optimization scripts available in the net. But the following are two FREE automated scripts you can use to optimize your indexes reliably and efficiently.

Index Defrag Script, v4.1


SQL Server Maintenance Solution

References:
Reorganize and Rebuild Indexes
ALTER INDEX (Transact-SQL)

Secret of "sp_updatestats"– feed your dragon

$
0
0
Query Optimizer vs. HR Manager
Let’s say you’re working in a company where there’s a couple of departments. Each department has a certain number of employees.

feed your dragon every day
The HR manager maintains a list of all staff in each department. He updates the list whenever there is an addition or any changes in staff. At any time if anyone ask the HR manager how many staff he has in the Finance Department, he will have the correct answer. Now, let’s say the HR manager went on vacation for two months and during that time there were a number of hires and turn overs but the staff list has not been updated yet.

The HR Manager came back from his vacation and someone asked him “how many staff do you have in the Finance department?” What will be the answer? As the list has not been updated, he will not be able to answer correctly. He needs to update the staff list for each department by utilizing the old Chinese abacus method. This will not be much enjoyable if the company is big and the HR Manager has to do a lot of work to correct the staff list.

This analogy is applicable to SQL Server optimizer. If the internal data distribution (statistics) is outdated, SQL Server will correct it. So, instead of SQL Server why don’t we just update it in the first place and on a regular basis?

Why is it so important?
To generate the optimal execution plan, SQL Server needs up-to-date statistics. Due to poor quality statistics, SQL Server creates sub-optimal plans and causes severe performance issues, such as high CPU, Table/Index Scan, and a Parallel plan. Query will start taking longer durations to finish then expected and locking overhead will introduce blocking and even a time-out issue. Not a good experience for the application user.

How statistics are created?
1.      When using a column in a query condition such as a WHERE or JOIN clause causes statistics to be created when automatic statistics creation is enabled.
2.      The query optimizer creates statistics automatically for indexes as a byproduct on tables or views when the index is created. These statistics (single or multi-column) are created on the key columns of the index.
3.      Statistics can be created manually with CREATE STATISTICS command.
4.      Using “sp_createstats” for all columns of all tables in a database explicitly. It creates single column statistics.

Query Optimizer of SQL Server always creates single column statistics with prefix “_WA_Sys_”.

Auto statistics update and threshold:
Generally SQL Server determines whether to update statistics based on changes to column modification counters (colmodctr).

There is an algorithm which triggers SQL Server to updates statistics. SQL Server keeps track of the number of changes for each column and triggers the statistics recompilation mechanism and the threshold is known as Recompilation threshold (RT).  RT depends on the table type (permanent versus temporary), and the number of rows in the table (cardinality) when a query plan is compiled. The recompilation thresholds for all tables referenced in a batch are stored with the query plans of that batch.

RT is calculated as follows. (Where n is the number of rows in the table when the statistics were gathered)

Permanent table
If n <= 500, RT = 500.
If n > 500, RT = 500 + 0.20 * n.
Temporary table
If n < 6, RT = 6.
If 6 <= n <= 500, RT = 500.
If n > 500, RT = 500 + 0.20 * n.
Table variable
Since table variable has no statistics, RT does not exist.

An important new feature for high-throughput OLTP environments is the ability to asynchronously (AUTO_UPDATE_STATISTICS_ASYNC ON) update statistics automatically.

Manual statistics update and drawback:
1.      When an index is created or rebuilt, only associated statistics will be updated and nothing else.
2.      When executing ALTER INDEX ALL … on a table, only the statistics associated with indexes are updated. Automatic or manual statistics created on the table will never be updated.
3.      “REORGANIZE” never updates any statistics.

Auto update and the consequence:
The statistics which are created automatically by SQL Server Query optimizer or manually, how will those be updated? If statistics auto creation and update mechanism have not been disabled then SQL Server will attempt to update those statistics whenever required. For a large table this might cause performance issues such as blocking if it triggers during a peak hour. And if for some reason it did not get updated, the old execution plan (which is now sub-optimal anyway due to changes of underlying data) will be used to execute the query. As a result query performance suffers badly.

How will you update “user or system created statistics”?
As “Automatic or user defined statistics created on the table will never be updated” by ALTER INDRX (ALL) REBUILD command, then the better way to update those statistics is by using “sp_updatestats” or manually each statistics at a time or we will have to depend on SQL Server auto-update mechanism solely. The last two processes may not be an effective option in many environments. Disabling auto update statistics is not recommend, and we also should not rely on auto mechanism completely and on the other hand we want to update the statistics beforehand.

“sp_updatestats” – how does it work?
MSDN says “sp_updatestats updates only the statistics that require updating based on the rowmodctr information in the sys.sysindexes catalog view, thus avoiding unnecessary updates of statistics on unchanged rows”. Also note that “sp_updatestats updates statistics on disabled non-clustered indexes and does not update statistics on disabled clustered indexes.”

“sp_updatestats” utilizes rowmodctr column and as well it utilizes another undocumented internal function “stats_ver_current” to conditionally check of an existing statistics to decide whether it needs to be updated or not.

A better approach to optimize databases:
Though each environment is unique statistics optimization is mandatory for the sake of the best possible query execution plans regardless of the size of table or the database. “sp_updatestats” will ensure the complete update of all statistics irrespective to how they were created. In my experience I found that updating statistics is much more important and crucial than rebuilding indexes.

A good way to optimize indexes and statistics:
1.      First rebuild all indexes based on a predefined fragmentation level; say 30%. Some indexes will not be touched and there will be some outdated statistics leftover.
2.      In the second step, run “sp_updatesstats”, which will take care of all the statistics.

A sample Script on how to use “sp_updatesstats” against all databases:
Following both scripts does the same job. You can use whichever you prefer.

/*******************************************************
** Statistics update on all db
*******************************************************/
EXEC sp_MSforeachdb 'if ''?'' NOT IN (''tempdb'') use ? exec sp_updatestats'

/*******************************************************
** Statistics update on all db
*******************************************************/
declare @name varchar(100)
declare db_cursor cursor
for
    select  s.[name]
    from    sys.databases s
    where   s.[name] not in ( 'tempdb' )
            and s.[state_desc] = 'ONLINE'
            and s.[user_access_desc] = 'MULTI_USER'
    order by s.[name]
open db_cursor
fetch next from db_cursor into @name
while @@FETCH_STATUS = 0
    begin
        exec ('use ' + @name )
        print '-----------------------------------------------'
        print 'Updating stats on db: ' + @name
        print '-----------------------------------------------'
        exec sp_updatestats
        fetch next from db_cursor into @name
    end
close db_cursor
deallocate db_cursor

Output of “sp_updatestats”

References:
sp_updatestats (Transact-SQL)

Statistics Used by the Query Optimizer in Microsoft SQL Server

Statistics Used by the Query Optimizer in Microsoft SQL Server

Statistical maintenance functionality (autostats) in SQL Server

Batch Compilation, Recompilation, and Plan Caching Issues in SQL Server 2005

Expected or Unexpected data file growth – how to manage?

$
0
0
As the business is growing, the database needs to grow at the same time. It is common to pre-size the data file beforehand based on various recorded activities. Usually the DBA manually increases the data file size on a regular basis in a maintenance window which reduces the dependency on SQL Server auto growth.

Although “Auto Growth” is reliable and a desirable mechanism, however a large growth causes performance issues. While data file growth kicks in, the target database will be locked during the expansion and the end-users suffer from time-out and inaccessibility issues. The database growth in the middle of business hour is not expected and not desirable. How do you manage a sudden or unexpected data file growth?

Database growth support:
There are two ways to manage database growth:
<!--[if !supportLists]-->(a)   <!--[endif]-->Traditional Path: Proactively increase the database size, or
<!--[if !supportLists]-->(b)   <!--[endif]-->SQL Server Auto Growth: Depends on the SQL Server auto growth mechanism.

The following are a few scenarios where database growth is required in order to support specific business activities:
<!--[if !supportLists]-->(a)   <!--[endif]-->Creating a large size database.
<!--[if !supportLists]-->(b)   <!--[endif]-->Restoring a backup in a staging server.
<!--[if !supportLists]-->(c)    <!--[endif]-->Performing massive ETL process.
<!--[if !supportLists]-->(d)   <!--[endif]-->Migrating data from one file to another file group.
<!--[if !supportLists]-->(e)   <!--[endif]-->DML operations.
<!--[if !supportLists]-->(f)     <!--[endif]-->ALTER the Database or adding file.

Intelligent way of managing:
Starting from Windows 2003, Microsoft introduced a new feature which is known as “instant file initialization”. This is a Windows feature which can be applied to the SQL Server Service account in the “local security policy”. This OS feature can be utilized in SQL 2005 and upper version.

Let’s explain what exactly it is. Say for example if you want to create a database of 10GB in size. When you execute CREATE database SQL Server will create the MDF file of 10GB and fills the empty space with zero (zeroing out).

But if the “instant file initialization” right is enabled with SQL Server then the data files will be initialized instantaneously and without filling any empty spaces with zeros.

Keep in mind that “instant file initialization” feature does not work on log file.

Enabling “instant file initialization”:
To take advantage of this feature, the “Perform volume maintenance tasks” windows right must be assigned to SQL Server Service Account. You can follow the below steps to assign the “Perform volume maintenance tasks”:

Start ->
  Run… ->type -  gpedit.msc
     Computer Configuration ->
       Windows Settings ->
          Security Settings ->
             Local Policies ->
               User Rights Assignment

Once the right is assigned, restart the SQL Server Service to take effect.

Figure: Local group policy editor:

<!--[if !vml]--><!--[endif]-->

ERRORLOG and “instant file initialization”:
The Trace flag 3004 can be used to see the information in the SQL Server errorlog regarding instant file initialization. “Trace flag 3004” only shows information about backups and file creations and “Trace flag 3605” redirects the output to the SQL errorlog.

dbcctraceon(3605, 3004,-1)
dbcctracestatus

Please note that the Trace flag 1806 is used to disable instant file initialization.

Good practices:
Pre-allocating data file size is a traditional way to control database growth and it was mostly used in the SQL 2000 era. However as SQL Server now supports the “instant file initialization” feature, it eliminates manual growth management activity. Therefore, considering the following a good way to handle database growth:

<!--[if !supportLists]-->(a)   <!--[endif]-->Assign “Perform volume maintenance tasks” to SQL Server service account.
<!--[if !supportLists]-->(b)   <!--[endif]-->Make sure Trace flag 1805 is not enabled.
<!--[if !supportLists]-->(c)    <!--[endif]-->Try not to use percentage based data file growth, such as 10%.
<!--[if !supportLists]-->(d)   <!--[endif]-->Use smaller data file growth per increment, such as 100MB per increment.
<!--[if !supportLists]-->(e)   <!--[endif]-->Make sure the log file is reasonably pre-sized.
<!--[if !supportLists]-->(f)     <!--[endif]-->Do not create multiple transaction log files.

Reviewing “Zeroing Out” behavior:
Without the “Perform volume maintenance tasks” right, SQL Server will fill the blank spaces with zero and this behavior can be found in the SQL Server Errorlog when 3605 and 3004 trace were enabled as stated above. Following is a screenshot:


<!--[if !vml]--><!--[endif]-->
Reference:
Database File Initialization
Viewing all 94 articles
Browse latest View live