Quantcast
Channel: SQL Server – performance and other stories
Viewing all 94 articles
Browse latest View live

SQL Server Port - How to open in Windows Firewall

$
0
0
In the IT security world, it is said that approximately 80% of all security breaches occur by insiders; directly or indirectly, willingly or unwillingly. Here our focus is local Windows firewall and to see whether it is correctly configured or not. It is essential to make sure that every Windows and SQL Server is secured and protected.

Although SQL Server resides inside a DMZ, it is still important to secure the SQL box for anything unforeseen and there is no reason to disable the windows firewall. By opening a couple of TCP or UDP ports without disabling the Windows Firewall will guarantee maximum protection of a SQL Box. 

In the following steps, we will configure Windows Firewall for the default port 1433 to allow traffic to pass through in Windows 2012 for SQL Server 2012.

Step by step guide:
1.      In “Server Manager” select “Local Server”. (figure # 1)
2.      From the “Tool” menu select “Windows Firewall with Advanced Security”.
3.      Select the “Inbound Rules” from the left hand side. From the Action pane select “New Rule”. (figure # 2)
4.      On the rule type dialog box, select “Port” and click next. (figure # 3)
5.      Select “TCP” and enter 1433 in the “Specific Local Ports” box. (figure # 4)
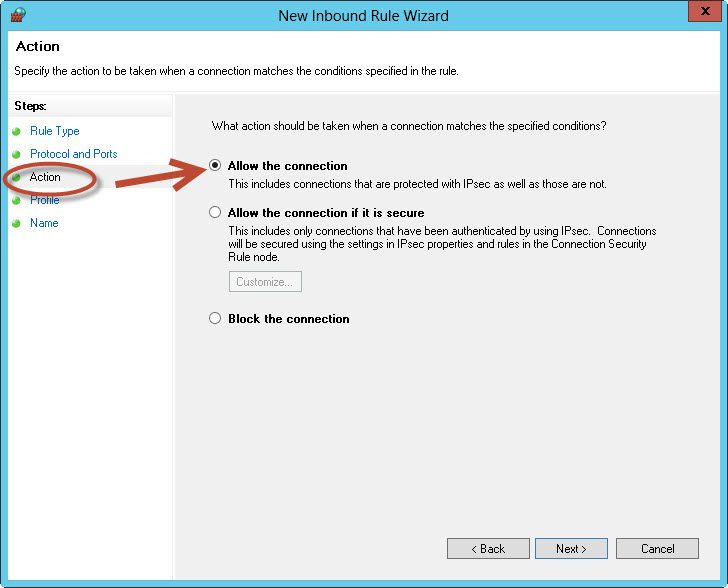
6.      On the next dialog box, select “Allow the connection”. (figure # 5)
7.      On the profile dialog box, select all three options: “Domain”, “Private” and “Public”. (figure # 6)
8.      On the last dialog box provide a name, e.g. “SQL Server Database Engine” and description. Then click finish button. (figure # 7)
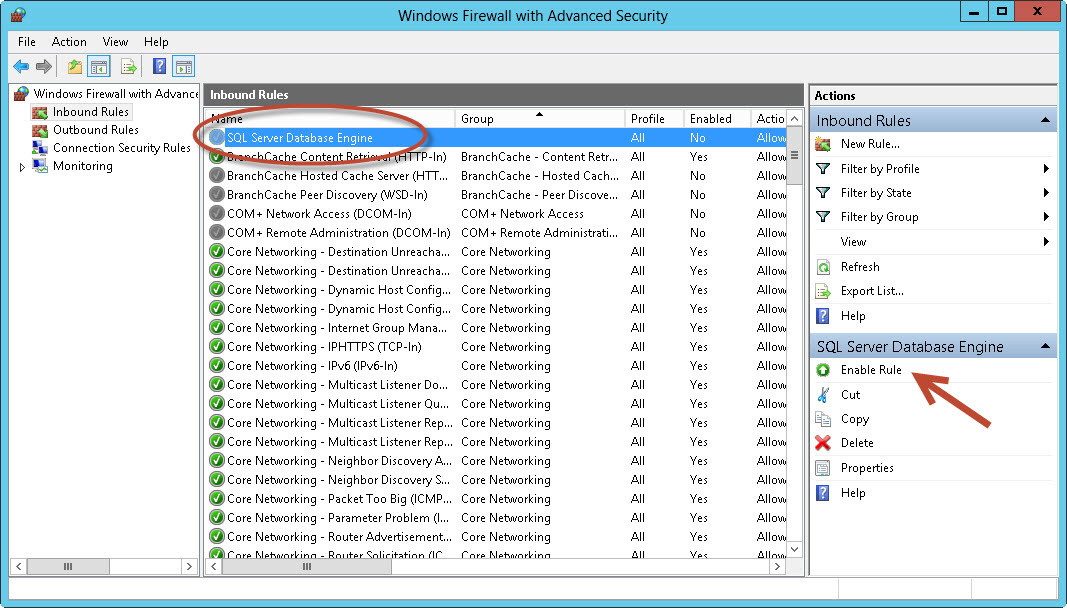
9.      On the “Windows Firewall with Advanced Security”, click “Enable rule”. (figure # 8)

Figure # 1:Windows Firewall configuration for SQL Server Port 1433

Figure # 2:Windows Firewall configuration for SQL Server Port 1433

Figure # 3:Windows Firewall configuration for SQL Server Port 1433

Figure # 4:Windows Firewall configuration for SQL Server Port 1433

Figure # 5:Windows Firewall configuration for SQL Server Port 1433

Figure # 6:Windows Firewall configuration for SQL Server Port 1433

Figure # 7:Windows Firewall configuration for SQL Server Port 1433

Figure # 8:Windows Firewall configuration for SQL Server Port 1433


Self-join incurs more I/O activities and increases locking overhead!

$
0
0
The Self-Join technique is commonly used to create a hierarchical tree set or finding duplicate records. It is also used to find previous or next values from a table by utilizing the inline table technique. Generally aself-join is a join in which a table is joined with itself. For example, when we need details about an employee and his manager where both employee and manager ID resides in the same table.

When we use self-join, it usually indicates that the table is not normalized. This may not be a problem for a small table but for a large and busy OLTP table with higher concurrency, this may lead to poor performance and degrade query response time.

The key point is that each self-joined table will be treated as a separate table while retrieving data from the disk, thus self-join incurs more I/O activities and increases locking overhead as it touches the same table twice or more. By adding appropriate indexes on JOIN and WHERE clause columns, it will reduce I/O activities and improve performance. It will be a good approach to avoid self-join whenever possible for heavy duty OLTP tables and queries.

Let’s perform a simple self-join test to see how the execution plan looks like. We can observe that as the retrieval number of records increases, each query behaves differently, such as requiring specific index and introducing parallel query.

Queries:
-- self-join one
selecttop (10)  a.xid,a.sIdentifier
from    tbllargea
        innerjointbllargebona.xid=b.xid
where   a.sIdentifier='A1'

-- self-join two
selecttop (100)  a.xid,a.sIdentifier
from    tbllargea
        innerjointbllargebona.xid=b.xid
where   a.sIdentifier='A1'

-- self-join three
selecttop (1000)  a.xid,a.sIdentifier
from    tbllargea
        innerjointbllargebona.xid=b.xid
where   a.sIdentifier='A1'

Execution Plan:

Index optimization - REBUILD vs. REORGANIZE

$
0
0
Index optimization is probably one of the most critical task every database support personnel has to perform on a regular basis. Based on DML operations in a particular environment, we adopt various optimization tasks, steps and strategies that suit our needs. Some tables or indexes may need frequent optimization, some do not need it at all for a longer period of time.

To optimize an index we have two options, REBUILD and REORGANIZE. Both work differently and have different effects. There are some differences which we should be aware of for better understanding of how each T-SQL command works and what does it do for us.

Good to Know some key points:
1.      When a non-clustered index is rebuilt, only the associate statistics for this index will be rebuilt.
2.      Rebuilding a clustered index does not rebuild associated non-clustered indexes unless the keyword ALL is specified.
3.      “HEAP” cannot be optimized. If “ALL” is specified and the underlying table is a heap, the rebuild operation has no effect on the table. Any non-clustered indexes associated with the table are rebuilt.
4.      The rebuild operation can be minimally logged if the database recovery model is set to either bulk-logged or simple.
5.      The options ONLINE = ON and IGNORE_DUP_KEY = ON are not valid while rebuilding an XML index or a spatial index.
6.      “STATISTICS_NORECOMPUTE = ON” means Out-of-date statistics are not automatically recomputed. “STATISTICS_NORECOMPUTE = OFF” means automatic statistic updating is enabled.
7.      If index options are not specified, the existing index option values stored in sys.indexeswill be used.
8.      ALTER INDEX cannot be used to repartition an index or move it to a different filegroup. This statement cannot be used to modify the index definition, such as adding or deleting columns or changing the column order.
9.      The values for ONLINE, MAXDOP, and SORT_IN_TEMPDB are not stored in the system catalog. You need to specify this OPTION in the index rebuild statement.
10.Reorganizing an index is always performed online. The process does not hold locks long term hence it does not block queries or updates that are running.
11.When you execute ALTER INDEX ALL … on a table, only the statistics associated with indexes are updated. Automatic or manual statistics created on the table will not be updated.
12.Index REBUILD can be a Parallel operation. Index REORGANIZE is always serial operation.
13.Rebuilding or reorganizing small indexes (which has 128 or less extents) often does not reduce fragmentation.
14.Reorganizing an index uses minimal system resources and also compacts the index pages.
15.Reorganizing an index does not update associate statistics.

Index Optimization Guideline:
The guideline that Microsoft has provided in the MSDN is a general guideline regardless of any DML operations happening in the database which need to be further reviewed by the database administrator based on his/her workload scenario to establish a better threshold.

The sys.dm_db_index_physical_stats can be used to determine fragmentation levelsin a specific index, in all indexes on a table or indexed view, in all indexes in a database, or in all indexes in all databases. The following table explains three important columns of the system function which need to be researched closely:

Column
Description
avg_fragmentation_in_percent
The percent of logical fragmentation (out-of-order pages in the index).
fragment_count
The number of fragments (physically consecutive leaf pages) in the index.
avg_fragment_size_in_pages
Average number of pages in one fragment in an index.

Action threshold recommended by Microsoft.
avg_fragmentation_in_percent
T-SQL Command
> 5% and < = 30%
ALTER INDEX REORGANIZE
> 30%
ALTER INDEX REBUILD (All Edition)
ALTER INDEX REBUILD WITH (ONLINE = ON) (Enterprise Edition)
Number of Extents > 128
Will be a good candidate for index optimization

The above threshold is a recommendation only. As every environment is different therefore it is a good idea to research the best threshold that will suit your need.

DMV Query:
The following DMV query can be used to pull detail information about indexes.
/*********************************************************************************
Script: Index Fragmentation Status (includes Partitioned Tables/Indexes)
**********************************************************************************/
select  schema_name(o.schema_id)as[schema_name],
        object_name(o.object_id)as[table_name],
        i.nameas[index_name],
        i.type_descas[index_type],
        dmv.page_count,
        dmv.fragment_count,
        round(dmv.avg_fragment_size_in_pages,2, 2)[avg_fragment_size_in_pages],
        round(dmv.avg_fragmentation_in_percent,2, 2)[avg_fragmentation_in_percent],
        casewhendmv.avg_fragmentation_in_percent<=5 then'RELAX'
             whendmv.avg_fragmentation_in_percent<= 30 then'REORGANIZE'
             whendmv.avg_fragmentation_in_percent> 30 then'REBUILD'
        endas[action],
        stats_date(dmv.object_id,i.index_id)asstats_update_date,
        casewhenisnull(ps.function_id, 1)= 1 then'NO'
             else'YES'
        endaspartitioned,
        coalesce(fg.name,fgp.name)as[file_group_name],
        p.partition_numberas[partition_number],
        p.rowsas[partition_rows],
        prv_left.valueas[partition_lower_boundary_value],
        prv_right.valueas[partition_upper_boundary_value],
        casewhenpf.boundary_value_on_right=1 then'RIGHT'
             whenpf.boundary_value_on_right= 0 then'LEFT'
             else'NONE'
        endas[partition_range],
        pf.nameas[partition_function],
        ds.nameas[partition_scheme]
from    sys.partitionsaspwith (readpast)
        innerjoinsys.indexesasiwith (readpast)oni.object_id=p.object_id
                                                         andi.index_id=p.index_id
        innerjoinsys.objectsasowith (readpast)ono.object_id=i.object_id
        innerjoinsys.dm_db_index_physical_stats(db_id(),null,null,null,
                                                  N'LIMITED')dmvondmv.OBJECT_ID=i.object_id
                                                              anddmv.index_id=i.index_id
                                                              anddmv.partition_number=p.partition_number
        leftjoinsys.data_spacesasdswith (readpast)onds.data_space_id=i.data_space_id
        leftjoinsys.partition_schemesaspswith (readpast)onps.data_space_id=ds.data_space_id
        leftjoinsys.partition_functionsaspfwith (readpast)onpf.function_id=ps.function_id
        leftjoinsys.destination_data_spacesasddswith (readpast)ondds.partition_scheme_id=ps.data_space_id
                                                              anddds.destination_id=p.partition_number
        leftjoinsys.filegroupsasfgwith (readpast)onfg.data_space_id=i.data_space_id
        leftjoinsys.filegroupsasfgpwith (readpast)onfgp.data_space_id=dds.data_space_id
        leftjoinsys.partition_range_valuesasprv_leftwith (readpast)onps.function_id=prv_left.function_id
                                                              andprv_left.boundary_id=p.partition_number
                                                              - 1
        leftjoinsys.partition_range_valuesasprv_rightwith (readpast)onps.function_id=prv_right.function_id
                                                              andprv_right.boundary_id=p.partition_number
where   objectproperty(p.object_id,'ISMSShipped')= 0
orderby[avg_fragmentation_in_percent]DESC,
        [table_name],
        [index_name]

Output of the above script:

Good practice:
1.      Try not to DROP an index beforehand and re-create it again. Use ALTER INDEX WITH REBUILD.
2.      To change the index definition, use CREATE INDEX with the DROP_EXISTING clause to perform the operations.
3.      Be careful about “ALL” option.  When “ALL” is specified, all indexes on the table are dropped and rebuilt in a single transaction; Transaction Log will grow rapidly.
4.      Rebuilding indexes ONLINE might need longer time and you still see short duration blocking.
5.      Always choose off-peak hours to optimize indexes and try to use MAXDOP to take advantage of parallel index creation.

Index Optimization Script:
There are a number of automated index optimization scripts available in the net. But the following are two FREE automated scripts you can use to optimize your indexes reliably and efficiently.

Index Defrag Script, v4.1


SQL Server Maintenance Solution

References:
Reorganize and Rebuild Indexes
ALTER INDEX (Transact-SQL)

Secret of "sp_updatestats"– feed your dragon

$
0
0
Query Optimizer vs. HR Manager
Let’s say you’re working in a company where there’s a couple of departments. Each department has a certain number of employees.

feed your dragon every day
The HR manager maintains a list of all staff in each department. He updates the list whenever there is an addition or any changes in staff. At any time if anyone ask the HR manager how many staff he has in the Finance Department, he will have the correct answer. Now, let’s say the HR manager went on vacation for two months and during that time there were a number of hires and turn overs but the staff list has not been updated yet.

The HR Manager came back from his vacation and someone asked him “how many staff do you have in the Finance department?” What will be the answer? As the list has not been updated, he will not be able to answer correctly. He needs to update the staff list for each department by utilizing the old Chinese abacus method. This will not be much enjoyable if the company is big and the HR Manager has to do a lot of work to correct the staff list.

This analogy is applicable to SQL Server optimizer. If the internal data distribution (statistics) is outdated, SQL Server will correct it. So, instead of SQL Server why don’t we just update it in the first place and on a regular basis?

Why is it so important?
To generate the optimal execution plan, SQL Server needs up-to-date statistics. Due to poor quality statistics, SQL Server creates sub-optimal plans and causes severe performance issues, such as high CPU, Table/Index Scan, and a Parallel plan. Query will start taking longer durations to finish then expected and locking overhead will introduce blocking and even a time-out issue. Not a good experience for the application user.

How statistics are created?
1.      When using a column in a query condition such as a WHERE or JOIN clause causes statistics to be created when automatic statistics creation is enabled.
2.      The query optimizer creates statistics automatically for indexes as a byproduct on tables or views when the index is created. These statistics (single or multi-column) are created on the key columns of the index.
3.      Statistics can be created manually with CREATE STATISTICS command.
4.      Using “sp_createstats” for all columns of all tables in a database explicitly. It creates single column statistics.

Query Optimizer of SQL Server always creates single column statistics with prefix “_WA_Sys_”.

Auto statistics update and threshold:
Generally SQL Server determines whether to update statistics based on changes to column modification counters (colmodctr).

There is an algorithm which triggers SQL Server to updates statistics. SQL Server keeps track of the number of changes for each column and triggers the statistics recompilation mechanism and the threshold is known as Recompilation threshold (RT).  RT depends on the table type (permanent versus temporary), and the number of rows in the table (cardinality) when a query plan is compiled. The recompilation thresholds for all tables referenced in a batch are stored with the query plans of that batch.

RT is calculated as follows. (Where n is the number of rows in the table when the statistics were gathered)

Permanent table
If n <= 500, RT = 500.
If n > 500, RT = 500 + 0.20 * n.
Temporary table
If n < 6, RT = 6.
If 6 <= n <= 500, RT = 500.
If n > 500, RT = 500 + 0.20 * n.
Table variable
Since table variable has no statistics, RT does not exist.

An important new feature for high-throughput OLTP environments is the ability to asynchronously (AUTO_UPDATE_STATISTICS_ASYNC ON) update statistics automatically.

Manual statistics update and drawback:
1.      When an index is created or rebuilt, only associated statistics will be updated and nothing else.
2.      When executing ALTER INDEX ALL … on a table, only the statistics associated with indexes are updated. Automatic or manual statistics created on the table will never be updated.
3.      “REORGANIZE” never updates any statistics.

Auto update and the consequence:
The statistics which are created automatically by SQL Server Query optimizer or manually, how will those be updated? If statistics auto creation and update mechanism have not been disabled then SQL Server will attempt to update those statistics whenever required. For a large table this might cause performance issues such as blocking if it triggers during a peak hour. And if for some reason it did not get updated, the old execution plan (which is now sub-optimal anyway due to changes of underlying data) will be used to execute the query. As a result query performance suffers badly.

How will you update “user or system created statistics”?
As “Automatic or user defined statistics created on the table will never be updated” by ALTER INDRX (ALL) REBUILD command, then the better way to update those statistics is by using “sp_updatestats” or manually each statistics at a time or we will have to depend on SQL Server auto-update mechanism solely. The last two processes may not be an effective option in many environments. Disabling auto update statistics is not recommend, and we also should not rely on auto mechanism completely and on the other hand we want to update the statistics beforehand.

“sp_updatestats” – how does it work?
MSDN says “sp_updatestats updates only the statistics that require updating based on the rowmodctr information in the sys.sysindexes catalog view, thus avoiding unnecessary updates of statistics on unchanged rows”. Also note that “sp_updatestats updates statistics on disabled non-clustered indexes and does not update statistics on disabled clustered indexes.”

“sp_updatestats” utilizes rowmodctr column and as well it utilizes another undocumented internal function “stats_ver_current” to conditionally check of an existing statistics to decide whether it needs to be updated or not.

A better approach to optimize databases:
Though each environment is unique statistics optimization is mandatory for the sake of the best possible query execution plans regardless of the size of table or the database. “sp_updatestats” will ensure the complete update of all statistics irrespective to how they were created. In my experience I found that updating statistics is much more important and crucial than rebuilding indexes.

A good way to optimize indexes and statistics:
1.      First rebuild all indexes based on a predefined fragmentation level; say 30%. Some indexes will not be touched and there will be some outdated statistics leftover.
2.      In the second step, run “sp_updatesstats”, which will take care of all the statistics.

A sample Script on how to use “sp_updatesstats” against all databases:
Following both scripts does the same job. You can use whichever you prefer.

/*******************************************************
** Statistics update on all db
*******************************************************/
EXEC sp_MSforeachdb 'if ''?'' NOT IN (''tempdb'') use ? exec sp_updatestats'

/*******************************************************
** Statistics update on all db
*******************************************************/
declare @name varchar(100)
declare db_cursor cursor
for
    select  s.[name]
    from    sys.databases s
    where   s.[name] not in ( 'tempdb' )
            and s.[state_desc] = 'ONLINE'
            and s.[user_access_desc] = 'MULTI_USER'
    order by s.[name]
open db_cursor
fetch next from db_cursor into @name
while @@FETCH_STATUS = 0
    begin
        exec ('use ' + @name )
        print '-----------------------------------------------'
        print 'Updating stats on db: ' + @name
        print '-----------------------------------------------'
        exec sp_updatestats
        fetch next from db_cursor into @name
    end
close db_cursor
deallocate db_cursor

Output of “sp_updatestats”

References:
sp_updatestats (Transact-SQL)

Statistics Used by the Query Optimizer in Microsoft SQL Server

Statistics Used by the Query Optimizer in Microsoft SQL Server

Statistical maintenance functionality (autostats) in SQL Server

Batch Compilation, Recompilation, and Plan Caching Issues in SQL Server 2005

Expected or Unexpected data file growth – how to manage?

$
0
0
As the business is growing, the database needs to grow at the same time. It is common to pre-size the data file beforehand based on various recorded activities. Usually the DBA manually increases the data file size on a regular basis in a maintenance window which reduces the dependency on SQL Server auto growth.

Although “Auto Growth” is reliable and a desirable mechanism, however a large growth causes performance issues. While data file growth kicks in, the target database will be locked during the expansion and the end-users suffer from time-out and inaccessibility issues. The database growth in the middle of business hour is not expected and not desirable. How do you manage a sudden or unexpected data file growth?

Database growth support:
There are two ways to manage database growth:
<!--[if !supportLists]-->(a)   <!--[endif]-->Traditional Path: Proactively increase the database size, or
<!--[if !supportLists]-->(b)   <!--[endif]-->SQL Server Auto Growth: Depends on the SQL Server auto growth mechanism.

The following are a few scenarios where database growth is required in order to support specific business activities:
<!--[if !supportLists]-->(a)   <!--[endif]-->Creating a large size database.
<!--[if !supportLists]-->(b)   <!--[endif]-->Restoring a backup in a staging server.
<!--[if !supportLists]-->(c)    <!--[endif]-->Performing massive ETL process.
<!--[if !supportLists]-->(d)   <!--[endif]-->Migrating data from one file to another file group.
<!--[if !supportLists]-->(e)   <!--[endif]-->DML operations.
<!--[if !supportLists]-->(f)     <!--[endif]-->ALTER the Database or adding file.

Intelligent way of managing:
Starting from Windows 2003, Microsoft introduced a new feature which is known as “instant file initialization”. This is a Windows feature which can be applied to the SQL Server Service account in the “local security policy”. This OS feature can be utilized in SQL 2005 and upper version.

Let’s explain what exactly it is. Say for example if you want to create a database of 10GB in size. When you execute CREATE database SQL Server will create the MDF file of 10GB and fills the empty space with zero (zeroing out).

But if the “instant file initialization” right is enabled with SQL Server then the data files will be initialized instantaneously and without filling any empty spaces with zeros.

Keep in mind that “instant file initialization” feature does not work on log file.

Enabling “instant file initialization”:
To take advantage of this feature, the “Perform volume maintenance tasks” windows right must be assigned to SQL Server Service Account. You can follow the below steps to assign the “Perform volume maintenance tasks”:

Start ->
  Run… ->type -  gpedit.msc
     Computer Configuration ->
       Windows Settings ->
          Security Settings ->
             Local Policies ->
               User Rights Assignment

Once the right is assigned, restart the SQL Server Service to take effect.

Figure: Local group policy editor:

<!--[if !vml]--><!--[endif]-->

ERRORLOG and “instant file initialization”:
The Trace flag 3004 can be used to see the information in the SQL Server errorlog regarding instant file initialization. “Trace flag 3004” only shows information about backups and file creations and “Trace flag 3605” redirects the output to the SQL errorlog.

dbcctraceon(3605, 3004,-1)
dbcctracestatus

Please note that the Trace flag 1806 is used to disable instant file initialization.

Good practices:
Pre-allocating data file size is a traditional way to control database growth and it was mostly used in the SQL 2000 era. However as SQL Server now supports the “instant file initialization” feature, it eliminates manual growth management activity. Therefore, considering the following a good way to handle database growth:

<!--[if !supportLists]-->(a)   <!--[endif]-->Assign “Perform volume maintenance tasks” to SQL Server service account.
<!--[if !supportLists]-->(b)   <!--[endif]-->Make sure Trace flag 1805 is not enabled.
<!--[if !supportLists]-->(c)    <!--[endif]-->Try not to use percentage based data file growth, such as 10%.
<!--[if !supportLists]-->(d)   <!--[endif]-->Use smaller data file growth per increment, such as 100MB per increment.
<!--[if !supportLists]-->(e)   <!--[endif]-->Make sure the log file is reasonably pre-sized.
<!--[if !supportLists]-->(f)     <!--[endif]-->Do not create multiple transaction log files.

Reviewing “Zeroing Out” behavior:
Without the “Perform volume maintenance tasks” right, SQL Server will fill the blank spaces with zero and this behavior can be found in the SQL Server Errorlog when 3605 and 3004 trace were enabled as stated above. Following is a screenshot:


<!--[if !vml]--><!--[endif]-->
Reference:
Database File Initialization

Choosing an efficient clustered key - Other side of the moon

$
0
0
Other side of the moon
Choosing an efficient clustered key is a crucial factor of good database performance. However this factor is often neglected during database schema design time leading to poor performance. It also becomes difficult to resolve issues when the database grows into multi-terabytes in size and even using huge hardware will not reach the satisfactory performance goal.

What is a Clustered Key?
“Clustered indexes sort and store the data rows in the table based on their key values. There can only be one clustered index per table, because the data rows themselves can only be sorted in one order”. To improve performance, reducing the IO overhead is necessary to have a clustered key on almost all tables in a high transactional database. Although there are numerous guidelines and good practices that are available to understand the necessity of an appropriate clustered key in a table; the question is how often do we consider those practices while choosing a clustered key?
 
It is generally advisable that a clustered key should be the one which is narrow in length and has a unique value column (such as primary key). If the column is not unique then Database Engine will add a 4-byte uniqueifier value to each row to make the column unique. This added value is internal and can’t be seen or accessed by the user and has some internal overhead. However, the more inefficiency occurs when the clustered key is wider than needed.

Pitfall of in-efficient clustered key:
1.      Fragmentation: Rapidly introduces more fragmentation.
2.      Page Split: A huge number of page allocations and de-allocations happen.
3.      Space:Requires more disk & memory, and IO cost will be high.
4.      CPU Usage: Observe high CPU due to excessive page split.
5.      Slowness: Query response time decreases.
6.      Optimization: Index optimization requires more time.

Good Clustered Key:
1.      A unique key column is the best candidate for a clustered key.
2.      IDENTITY column is a good choice as they are sequential.
3.      The column which is used on a JOIN clause.
4.      The column used to retrieve data sequentially.
5.      The column used in SORT (GROUP or ORDER) operation frequently.
6.      Frequently used in range scan (such as BETWEEN, >=, =< )
7.      Static Column: such as EmployeeID, SSN.

In-efficient choice for clustered key:
1.      Wide Keys: multi-columns key. Such as LastName + FirstName + MiddleName or Address1 + Adddress2 + Phone, so on. “The key values from the clustered index are used by all non-clustered indexes as lookup keys. Any non-clustered indexes defined on the same table will be significantly larger because the non-clustered index entries contain the clustering key and also the key columns defined for that non-clustered index.
2.      GUID:Randomly generated unique values leads to highest possible fragmentation. NEWSEQUENTIALID() can be used  instead of NEWID() to create GUID to reduce fragmentation in a table.
3.      Data Changes: The column which has frequent value change is not a good choice for a clustered key.

Narrow vs. Wide Clustered Key Test:
Here we will be observing how a wide clustered key introduces performance issues. In our example,
(a)   “xID” is the Clustered Key which is a Primary Key and an Identity column.
(b)   Later we will create a multi-column clustered key by using “sName1”, “sName2” and “sName3” which are varchar columns.
(c)    We will insert 100,000 rows for this test
(d)   We will review fragmentation and page split for type of indexes.

DMV Query:
--To check table and index level changes:
SELECT  OBJECT_NAME(ios.object_id,ios.database_id)astable_name,
              ios.index_id,
        si.nameASindex_name,
        ios.leaf_insert_count+
        ios.leaf_update_count+
        ios.leaf_delete_countASleaf_changes,
        ios.leaf_allocation_countASleaf_page_splits,
        ios.nonleaf_insert_count+
        ios.nonleaf_update_count+
        ios.nonleaf_delete_countASnonleaf_changes,
        ios.nonleaf_allocation_countASnonleaf_page_splits,
        (ios.range_scan_count+ios.leaf_insert_count
            +ios.leaf_delete_count+ios.leaf_update_count
            +ios.leaf_page_merge_count+ios.singleton_lookup_count
           )total_changes
FROM    sys.dm_db_index_operational_stats(DB_ID(),NULL,NULL,NULL)ios
        JOINsys.objectssoONso.object_id=ios.object_id
        JOINsys.indexessiONsi.object_id=ios.object_id
                               ANDsi.index_id=ios.index_id
        JOINsys.schemasssONso.schema_id=ss.schema_id
WHERE   OBJECTPROPERTY(ios.object_id,'IsUserTable')= 1
ORDERBYleaf_changesDESC

--To check index fragmentation:
SELECT  a.index_id,
        b.nameAS[object_name],
        CONVERT(NUMERIC(5,2),a.avg_fragmentation_in_percent)pct_avg_fragmentation
FROM    sys.dm_db_index_physical_stats(DB_ID(),NULL,NULL,NULL,NULL)ASa
        JOINsys.indexesASbONa.object_id=b.object_id
                                 ANDa.index_id=b.index_id;


Script to test:
CREATEDATABASETestDB
GO
USE[TestDB]
GO

CREATETABLE[tblLarge](
       [xID][int]IDENTITY(1,1)NOTNULL,
       [sName1][varchar](10)DEFAULT'ABC'NOTNULL,
       [sName2][varchar](13)DEFAULT'ABC'NOTNULL,
       [sName3][varchar](36)DEFAULT'ABC'NOTNULL,
       [sIdentifier][char](2)NULL,
       [dDOB][date]NULL,
       [nWage][numeric](12, 2)NULL,
       [sLicense][char](7)NULL,
       [bGender][bit]NULL
)ON[PRIMARY]
GO


-- Clustered key on xID
ALTERTABLEtblLargeADDCONSTRAINTPK_tblLarge
PRIMARYKEYCLUSTERED (xID)WITH (FILLFACTOR=90)
GO

-- DROP constraint
ALTERTABLE[dbo].[tblLarge]DROPCONSTRAINT[PK_tblLarge]
GO

-- Multi-column clustered key
ALTERTABLEtblLargeADDCONSTRAINTPK_tblLarge
PRIMARYKEYCLUSTERED (sName1,sName2,sName3)WITH (FILLFACTOR=90)
GO

-- Insert 100,000 records
            INSERT  INTOtblLarge
                    (sName1,
                      sName2,
                      sName3,
                      sIdentifier,
                      dDOB,
                      nWage,
                      sLicense,
                      bGender
                    )
            VALUES  (LEFT(CAST(NEWID()ASVARCHAR(36)), 8),
                      LEFT(CAST(NEWID()ASVARCHAR(36)), 13),
                      CAST(NEWID()ASVARCHAR(36)),
                      LEFT(CAST(NEWID()ASVARCHAR(36)), 2),
                      DATEADD(dd,-RAND()* 20000,GETDATE()),
                      (RAND()* 1000 ),
                      SUBSTRING(CAST(NEWID()ASVARCHAR(36)), 6, 7),
                      COALESCE(ISNUMERIC(LEFT(CAST(NEWID()ASVARCHAR(36)),1)),0))
GO 100000


Fragmentation Comparison:
As you can see from the following picture given below that the fragmentation and page split has been increased dramatically when wide key has been used.

Figure#1: Narrow clustered key


Figure#2: Multi-column clustered key


Conclusion:
While using wide key or multi-columns for clustered index is supported by SQL Server, but we should not overlook the dangerous performance consequences that occurs silently. 


Reference:
Clustered Index Design Guidelines

NUMA - Memory and MAXDOP settings

$
0
0
It is common practice to put more hardware power to alleviate the application performance issues rather than fixing the issues. For short life and non-mission critical applications, it makes sense. But for the mission critical applications that benefit from upgraded hardware, it does not last long. Fixing application issues become more obvious and important. At the same time, tweaking the server configuration is also necessary to operate the Database server flawlessly.

Modern hardware, such as NUMA based server technology, has a tremendous capability to process application requests faster than SMP architecture. Microsoft SQL Server is fully capable of using the NUMA architecture and taking advantage of it. Starting from SQL 2000 SP4, Microsoft supports Hardware NUMA and in each release, support for the NUMA architecture is getting enhanced.

NUMA and Memory Setting:
In a NUMA based system, memory setting (min server memory and max server memory) plays an important role. It is generally the best practice to configure memory in such a way that allocated memory is distributed evenly across all NUMA nodes. This will help each NUMA node to operate independently without demanding memory from other nodes. Accessing memory on another NUMA node is called “remote memory access” and accessing memory on the same NUMA node is called “local memory access”. Accessing different node for memory introduces latency.

To get best out of the NUMA system, the following settings are highly recommended:

1.      Lock Pages in Memory: The SQL Server Service account needs to have “Lock Pages in Memory” in place in the Windows local security policy. This will prevent paging out SQL Server memory back to Windows.

2.      Max and Min Server Memory: Max and Min server memory will need to be equal for two reasons:

(a)   This will reduce overhead (allocation and de-allocation) that would otherwise be used by SQL Server dynamically managing these values.
(b)   As Memory calculation is usually derived from “Max Server Memory”, SQL Server Engine will have better values to allocate physical memory evenly to each NUMA node. This will reduce “Foreign Memory” requirement that occurs during data processing on one node.

3.      MAXDOP: For servers that have NUMA configured, MAXDOP should not exceed the number of CPUs that are assigned to each NUMA node. Meaning that if a server has 4 NUMA nodes and each NUMA node consists with 4 CPUs then MAXDOP will be 4 or less. This will reduce threading overhead that occurs which will then be utilizing more NUMA nodes simultaneously.

Memory Allocation in each NUMA node:
To learn how much memory each node has received, PerfMon or sys.dm_os_perfromance_counterscan be used. Following is a buffer allocation from an 8 node NUMA system.

DMV Query:
select  counter_name,
        cntr_value* 8 / 1024 node_memory_mb,
        instance_name
from    sys.dm_os_performance_counters
where   [object_name]like'%Buffer Node%'
        andcounter_namelike'Total Pages%'
orderbyinstance_name
computesum(cntr_value* 8 / 1024 )


select  counter_name,
        cntr_value* 8 / 1024  total_buffer_mb,
        instance_name
from    sys.dm_os_performance_counters
where   [object_name]like'%Buffer Manager%'
        andcounter_namelike'Total Pages%'
orderbyinstance_name


CPU Usages in each NUMA Node:


Some disadvantages:
Although NUMA architecture is increasing processing power, there are some usage patterns which introduce some Latch contention in 32+ cores. In that case, database schema design such as index needs to be reviewed. A detailed guideline can be found in Microsoft’s technical document paper: “Diagnosing and Resolving Latch Contention on SQL Server”.

If overtime “Foreign Pages” counter is high for one or more nodes, this usually means that the nodes require more memory to perform a particular workload. While adding more memory might help, it is recommended to see if the query can be optimized along with index changes.

Read More:
SQL Server and Large Pages Explained

Recommendations and guidelines for the "max degree of parallelism" configuration option in SQL Server

SQL Server, Buffer Node Object

Diagnosing and Resolving Latch Contention on SQL Server

How It Works: SQL Server (NUMA Local, Foreign and Away Memory Blocks)

SQL Server, CPU and Power Policy – save the civilization

$
0
0
From the dawn of time, power has been linked with human history; in the past, present and future. The advancement of our species, the Homo sapiens, has been one of the most successful organisms on Earth to this day. The lighting of fire had fueled the creation for a modern world and that is what separated our evolutionary abled bodies from the ape species which existed before.

We produce power and consume it every nanosecond to continue through our daily lives. We also have concerns about using unnecessary power and we encourage others to reduce power so that we can save our planet and preserve it for our future generation. This makes sense.

We need to think carefully about how to use power and consume it effectively in SQL Server OLTP implantation.

OLTP and Windows Power Policy:
In cases, especially in OLTP and CPU-intensive application where concurrency is high, we want to make sure that the database server receives enough power to process each instruction without any latency. Saving some power in such cases is not an option as the power consumption directly affects CPU, which brings CPU latency and increases application response time.

Windows Power Policy:
In Windows 2008, there are three power consumption options (power plan), where “Balanced” is set to default and many SysAdmin or DBA never think to change to high performance mode. As a result, performance hurts and the overall performance degrades dramatically which can’t be understood the usual way. As per different leading experts research, “High Performance” mode will provide 10% to 30% overall performance improvement.

However, just enabling “High Performance” mode does not guarantee that Windows will be able to consume power uninterruptedly. To make this Windows configuration effective, we also need to configure server BIOS power management to “OS Control” mode. Without this configuration, Windows or ESX will not operate as desired.

Virtualization:
The populate virtualization application VMWare also recommends using “OS Control“ in hardware BIOS level and configure “High performance” mode in ESXi power Management. This configuration is also recommended in Microsoft Hyper-V implementation.

Power and CPU correlation Testing:
There is a tool which is known as “Geekbench” which can be used to test how power consumption affects the CPU Performance. You can find this tool at http://www.primatelabs.com/geekbench/. Geekbench is widely used by many industry experts as a CPU stress testing tool.

Figure: HP power management
Figure: Windows 2008 power management

 Figure: ESXi power management


References:
Degraded overall performance on Windows Server 2008 R2
http://support.microsoft.com/kb/2207548

Configuring Windows Server 2008 Power Parameters for Increased Power Efficiency
http://blogs.technet.com/b/winserverperformance/archive/2008/12/04/configuring-windows-server-2008-power-parameters-for-increased-power-efficiency.aspx

Host Power Management in VMware vSphere 5.5
http://www.vmware.com/resources/techresources/10205
 

“xp_delete_file”: A simple PowerShell Script alternative

$
0
0
There are numerous threads that can be found on “xp_delete_file” regarding various issues when used in a Maintenance Plan in SQL Server to remove old database backup (bak) or transaction backup (trn) from the disk and folder. This is a built-in and undocumented extended stored procedure and used internally by the Maintenance Plan Wizard. This Extended Stored Procedure can also be executing manually in SSMS such as:

declare@filedatedatetime
set@filedate=getdate()- 5
executemaster.dbo.xp_delete_file0,'d:\temp\','bak',@filedate, 1

Issues:
We often find that the maintenance task fails with the following error message in ERROR Log and SQL Agent Job history respectively. In addition to the message, we will also see mini-dump in the SQL Server log folder.

Error: 18002, Severity: 20, State: 1.
Exception happened when running extended stored procedure 'xp_delete_file' in the library 'xpstar.dll'. SQL Server is terminating process 73. Exception type: Win32 exception; Exception code: 0xc0000005.

Source: Maintenance Cleanup Task Execute SQL Task Description: Executing the query "EXECUTE master.dbo.xp_delete_file 0, N'd:\temp', N'trn', N'2010-01-21T13:00:00'" failed with the following error: "A severe error occurred on the current command. The results, if any, should be discarded. A severe error occurred on the current command. The results, if any, should ... The package execution fa... The step failed.

If we run “xp_delete_file” manually in SSMS, we may see the following error message:

Msg 0, Level 11, State 0, Line 0
A severe error occurred on the current command.  The results, if any, should be discarded.
Msg 0, Level 20, State 0, Line 0
A severe error occurred on the current command.  The results, if any, should be discarded.

Alternative to “xp_delete_file”:
As this functionality has some known issues and consequences, it is wise to use PowerShell script as an alternative.  Following are a few examples on how to remove older “bak” or “trn” files from a folder as well as from sub-folder. This PowerShell Script can be used to delete any kind of files from disk.

Example One (based on number of days):
Remove database backup files with the extension “bak” which are longer than 5 days old.

# target path
$TargetPath="d:\temp\"

# files to delete more than 5 days
$Days= 5

# extension of the file to delete
$Extension="*.bak"
$CurrentDate=Get-Date
$LastWrite=$CurrentDate.AddDays(-$days)

# Get files based on lastwrite filter in the specified folder
$FilesToDeletes=Get-Childitem$targetpath-Include$Extension-Recurse|Where{$_.LastWriteTime-le"$LastWrite"}

foreach($Filein$FilesToDeletes)
    {
    if ($File-ne$NULL)
        {   
        Remove-Item$File.FullName|out-null
        }
    }


Example Two (based on number of hours):
Remove transaction log backup files with the extension “trn” which are longer than 10 hours old.

# target path
$TargetPath="d:\temp\"

# files to delete more than 10 hours
$Hours= 10

# extension of the file to delete
$Extension="*.trn"
$CurrentDate=Get-Date
$LastWrite=$CurrentDate.AddHours(-$Hours)

# Get files based on lastwrite filter in the specified folder
$FilesToDeletes=Get-Childitem$targetpath-Include$Extension-Recurse|Where{$_.LastWriteTime-le"$LastWrite"}

foreach($Filein$FilesToDeletes)
    {
    if ($File-ne$NULL)
        {   
        Remove-Item$File.FullName|out-null
        }
    }


Using PowerShell script in SQL Agent Job (SQL 2008+):
Using PowerShell Script in SQL Server Agent Job is simple. Follow the steps described below:

1.      Create a new SQL Agent Job, for example “Remove_older_BAK_files”.
2.      “In the Job Step properties” – select “PowerShell” as a type (figure #1).
3.      Paste the PowerShell script. Don’t forget to adjust your path and day parameter according to your need.
4.      Exit by saving the job and then execute it.

If you want to use the above job in a Maintenance Plan, you can use “SQL Server Agent Job Task” as shown below (figure #2).

Figure #1: SQL Agent Job with PowerShell Script:


Figure #2: Maintenance Plan with PowerShell Scripted Job:


DATEDIFF function– A common performance problem

$
0
0
DATEDIFF is one of the most widely used built-in functions to calculate the difference between two date points. Microsoft says DATEDIFF can be used in the select list, WHERE, HAVING, GROUP BY and ORDER BY clauses. Programmatically and logically this statement is absolutely correct, however there is a catch when it is used on the WHERE clause. We often introduce “non-sargable” predicate with the DATEDIFF function which leads to poor performance. I don’t think that there are good guidelines for many new developers.

Usage patterns:
As a rule of thumb, we know that using function on the left side of the WHERE clause causes Table or Index scan. So when the DATEDIFF function or any other functions are used on a key column, we will obviously see performance issues. Some common patterns of DATEDIFF functions are as follows:

WHEREDATEDIFF(day,dJoinDate,@CurrentDate)>=30
WHEREDATEDIFF(d,dDateofBirth,@dDate)=0
WHEREa.LastNameLIKE  'Jon*'ANDDATEDIFF(d,a.dSalesDate,@dDate)=0
WHEREDATEDIFF(mm,dDate,GetDate())>= 15
WHEREYEAR(a.dDate)=2012

Issues observed:
Following are some definite issues which can be observed:
1.      Increased query response times.
2.      Table/Index scan in execution plans.
3.      Short or long durations of SQL blockings.
4.      Increasing of locking overhead.
5.      Unnecessary I/O activities and memory pressure.
6.      Parallel query plan and “sort operation”.

Sample Scripts to understanding the performance issues:
Let’s create a database and table; and then populate the table with data to explore some of the performance issues which may arise from a non-sargable predicates.

/******************************************************
Create database and some relevant stuff
******************************************************/
setnocounton
createdatabaseTestDB
go

useTestDB
go

ifobject_id('tblLarge')isnotnull
    droptabletblLarge
go

createtabletblLarge
    (
      xIDintidentity(1, 1),
      sName1varchar(100),
      sName2varchar(1000),
      sName3varchar(400),
      sIdentifierchar(100),
      dDOBdatetimenull,
      nWagenumeric(20, 2),
      sLicensevarchar(25)
    )
go


/******************************************************
Add some records with non-blank dDOB
******************************************************/
setnocounton
insert  intotblLarge
        (sName1,
          sName2,
          sName3,
          sIdentifier,
          dDOB,
          nWage,
          sLicense
        )
values  (left(cast(newid()asvarchar(36)),rand()* 50),    -- sName1
          left(cast(newid()asvarchar(36)),rand()* 60),    -- sName2
          left(cast(newid()asvarchar(36)),rand()* 70),    -- sName2
          left(cast(newid()asvarchar(36)), 2),              -- sIdentifier    
          dateadd(dd,-rand()* 20000,getdate()),            -- dDOB
          (rand()* 1000 ),                                  -- nWage
          substring(cast(newid()asvarchar(36)), 6, 7)        -- sLicense       
        )
go 100000


/******************************************************
Create indexes
******************************************************/
altertabledbo.tblLargeaddconstraint
PK_tblLargeprimarykeyclustered
(
xID
)with(pad_index=off,
          fillfactor= 85,
          allow_row_locks=on,
          allow_page_locks=on)
go

createnonclusteredindex[IX_tblLarge_dDOB_sName1]on[dbo].[tblLarge]
(      [dDOB]asc,
[sName1]asc
)with (pad_index=off,
          allow_row_locks=on,
          allow_page_locks=on,
          fillfactor= 85)
go


Example #1: DATEDIFF: non-sargable predicate:
Let’s consider the following commonly used patterns of the DATEDIFF function:

declare@dDateasdatetime
set@dDate='2012-09-19'

-- #0: non-sargable search
select  xID,
        sName1,
        dDOB
from    tblLarge
where   datediff(d,dDOB,@dDate)= 0
orderbydDOB


The above query results with Index Scan and below is the execution plan:


Optimizing the search:
The above query can be optimized a couple different ways and will result in an efficient execution plan:

-- #1: sargable predicate
select  xID,
        sName1,
        dDOB
from    tblLarge
where   dDOBbetween'20120919'and'20120920'
orderbydDOB

-- #2: sargable predicate
select  xID,
        sName1,
        dDOB
from    tblLarge
where   dDOBbetweencast(convert(varchar(12),@dDate, 112)+' 00:00:00'asdatetime)
             and     cast(convert(varchar(12),@dDate+ 1, 112)+' 00:00:00'asdatetime)
orderbydDOB

-- #3: sargable predicate
select  xID,
        sName1,
        dDOB
from    tblLarge
where   dDOBbetweenconvert(char(8),@dDate, 112)
             and     convert(char(8),@dDate+ 1, 112)
orderbydDOB


Following are the execution plans and cost comparisons:

Example #2: DATEDIFF: non-sargable predicate:
Consider the following as a non-sargable example.

declare@dDateasdatetime
set@dDate='2013-11-19'

select  xID,
        sName1,
        dDOB
from    tblLarge
where   datediff(dd,dDOB,@dDate)<= 1
orderbydDOB


To optimize the above query we can move the DATEDIFF function from left side to the right side.

declare@dDateasdatetime
set@dDate='2013-11-19'

select  xID,
        sName1,
        dDOB
from    tblLarge
where   dDOB>=dateadd(dd,-1,@dDate)
orderbydDOB

Following is the optimization effort which results in better query response time.


Example #3: YEAR- non-sargable predicate:
This is an example of YEAR function used on datetime column which results with index scan and can be re-written in a slightly different way.

-- non-sargable
select  xID,
        sName1,
        dDOB
from    tblLarge
where   year(dDOB)= 2010
orderbydDOB

-- sargable
select  xID,
        sName1,
        dDOB
from    tblLarge
where   dDOB>='01-01-2010'
        anddDOB<'01-01-2011'
orderbydDOB

Execution plan and cost comparison:


Summary:
Writing efficient query for OLTP application needs more careful consideration and understanding of various techniques. Just satisfying the business requirement is not enough; we also need to make sure each query is a super performer by removing non-sargable predicates. 

Compressing everything in a SQL Server Database

$
0
0
Data compression is one of the most appreciated features of SQL Server. However, many of us overlook the benefits of data compression in terms of storage and query performance. If applied correctly, we could have save up to 30% disk space and speed up the query by at least 10 times. Although, there will be a penalty of 2% to 5% of increased CPU usage while compressing or decompressing pages, the gain is far more significant than adding some negligible processor usage.

Data Compression Setting:
Data compression is a feature of Enterprise Edition only and there is no any specific or particular server or database wide setting that can be turned on to implement the feature either server wide or on a per database basis. I think that the folks at Microsoft should consider implementing database compression feature settings at a database level so that we can use this feature more effectively.

What to compress?
Data compression needs to be applied individually on a per table or index basis and it can be applied to a heap table, clustered index, non-clustered index, indexed view, columnstore table and an index. For example, a clustered index table might have four non-clustered indexes and one nonclustered columnstore index. Thus you can have “PAGE” level compression on the clustered index, “ROW” level compression on the nonclustered indexes, “PAGE” level compression on the nonclustered indexes and “COLUMNSTORE_ARCHIVE” on a nonclustered columnstore index.

Figure#1: Different data compression settings on a table:

Some Good Points from MSDN:
1.      Enabling compression can cause query plans to change because the data is stored using a different number of pages and number of rows per page.
2.      Compression does not affect backup and restore.
3.      Compression does not affect log shipping.
4.      Compression has some affect and consideration on replication.
5.      Data compression is incompatible with sparse columns.
6.      When data is exported, even in native format, the data is output in the uncompressed row format.
7.      When data is imported, if the target table has been enabled for compression, the data is converted by the storage engine into compressed row format.
8.      When a clustered index is dropped, the corresponding heap partitions retain their data compression setting unless the partitioning scheme is modified. If the partitioning scheme is changed, all partitions are rebuilt to an uncompressed state.
9.      Columnstore tables and indexes are always stored with columnstore compression. To reduce the size of columnstore data further, configuring an additional compression called archival compression can be used. It may slow down the query execution and introduce high resource utilization.
10.  Compression is not available for system tables.
11.  A clustered index or Heap table can have different types of data compression levels.
12.  Regular index settings/options can be used with clustered or nonclustered indexes.
13.  Clustered or nonclustered columnstore indexes have fewer index settings.

Script to check data compression level:
Following is a handy script to check what has already been compressed and what has not:

/************************************************************
 * Check data compression level
 ************************************************************/ 
SELECT SCHEMA_NAME(o.schema_id)+'.'+OBJECT_NAME(o.object_id)AS table_name,
       o.type_desc,
       i.name                   ASindex_name,
       p.data_compression_desc  AScompression_type,
       i.type_desc              ASstorage_type
FROM   sys.partitions p
       INNERJOINsys.objects o
            ON  p.object_id= o.object_id
       JOINsys.indexes i
            ON  p.object_id= i.object_id
            ANDi.index_id = p.index_id
-- WHERE  p.data_compression> 0
--     ANDOBJECT_NAME(o.object_id)='Address1'

You can also get the similar information by using my free tool.

Figure#2: Different data compression settings on a table:
 
Some T-SQL Script to compress data in a database:

(a)    Compress all HEAP in a database:

/************************************************************
 * Data compression on HEAP
 ************************************************************/
SELECT'ALTER TABLE ['+SCHEMA_NAME(o.schema_id)+'].['+ o.[name]
       +'] REBUILD PARTITION = ALL WITH (DATA_COMPRESSION = PAGE)'
FROM   sys.objects o
       JOINsys.indexes i
            ON  o.[object_id] = i.[object_id]
WHERE  o.[type_desc] ='USER_TABLE'
       AND i.type_desc IN('HEAP')

(b)   Compress all CLUSTERED index tables:

/************************************************************
 * Data compression on a CLUSTERED index table and underlying indexes
 ************************************************************/
SELECT'ALTER INDEX ALL ON ['+SCHEMA_NAME(o.schema_id)+'].['+ o.[name]
       +'] REBUILD WITH (DATA_COMPRESSION = PAGE)'
FROM   sys.objects o
       JOINsys.indexes i
            ON  o.[object_id] = i.[object_id]
WHERE  o.[type_desc] ='USER_TABLE'
       AND i.type_desc IN('CLUSTERED')
  
(c)    Compress all NONCLUSTERED indexes:

/************************************************************
 * Data compression on nonClustered index
 ************************************************************/
SELECT'ALTER INDEX ['+ i.[name] +']'+' ON ['+SCHEMA_NAME(o.schema_id)+'].['+ o.[name]
       +'] REBUILD PARTITION = ALL WITH (DATA_COMPRESSION = PAGE)'
FROM   sys.objects o
       JOINsys.indexes i
            ON  o.[object_id] = i.[object_id]
WHERE  o.[type_desc] ='USER_TABLE'
       AND i.type_desc IN('NONCLUSTERED')
  
(d)   Compress all CLUSTERED COLUMNSTORE tables:

/************************************************************
 * Data compression on Clustered columnstore index
 ************************************************************/
SELECT'ALTER TABLE ['+SCHEMA_NAME(o.schema_id)+'].['+ o.[name]
       +'] REBUILD PARTITION = ALL WITH (MAXDOP = 16, DATA_COMPRESSION = COLUMNSTORE_ARCHIVE)'
FROM   sys.objects o
       JOINsys.indexes i
            ON  o.[object_id] = i.[object_id]
WHERE  o.[type_desc] ='USER_TABLE'
       AND i.type_desc IN('CLUSTERED COLUMNSTORE')

(e)   Compress all NONCLUSTERED COLUMNSTORE indexes:

/************************************************************
 * Data compression on nonClustered columnstore index
 ************************************************************/
SELECT'ALTER INDEX ['+ i.[name] +']'+' ON ['+SCHEMA_NAME(o.schema_id)+'].['+ o.[name]
       +'] REBUILD PARTITION = ALL WITH (MAXDOP = 16, DATA_COMPRESSION = COLUMNSTORE_ARCHIVE)'
FROM   sys.objects o
       JOINsys.indexes i
            ON  o.[object_id] = i.[object_id]
WHERE  o.[type_desc] ='USER_TABLE'
       AND i.type_desc IN('NONCLUSTERED COLUMNSTORE')

(f)     Data compression with different index settings:

/****************************************************************
 * Data compression on all nonclustered indexes
 *****************************************************************/
DECLARE @table_name ASVARCHAR(256)
DECLARE @index_name ASVARCHAR(256)
DECLARE @schema_name ASVARCHAR(256)
DECLARE @type_desc ASVARCHAR(50)

DECLARE CurCompress CURSOR
FOR
    SELECTSCHEMA_NAME(o.[schema_id])  AS[schema_name],
           o.[name]                    AS[table_name],
           i.[name]                    AS[index_name],
           i.[type_desc]
    FROM   sys.objects o
           JOINsys.indexes i
                ON  o.[object_id] = i.[object_id]
    WHERE  o.[type_desc] ='USER_TABLE'
    ORDERBY
           o.[name]
      
OPEN CurCompress
FETCHNEXTFROM CurCompress INTO@schema_name, @table_name, @index_name,@type_desc
WHILE@@fetch_status= 0
BEGIN
    IF@type_desc ='NONCLUSTERED'
    BEGIN
        PRINT'/****************************************************************************************'
        PRINT'* Data compression for the table: '+ @table_name
        PRINT'****************************************************************************************/'
        PRINT'ALTER INDEX ['+@index_name +'] ON ['+ @schema_name +'].['+@table_name +'] '
        PRINT'REBUILD WITH ('
        PRINT'        FILLFACTOR = 95,'
        PRINT'        SORT_IN_TEMPDB = OFF,'
        PRINT'        STATISTICS_NORECOMPUTE = OFF,'
        PRINT'        ONLINE = OFF,'
        PRINT'        ALLOW_ROW_LOCKS = ON,'
        PRINT'        ALLOW_PAGE_LOCKS = ON,'
        PRINT'        MAXDOP = 16,'
        PRINT'        DATA_COMPRESSION = PAGE'
        PRINT')'
        PRINT'GO'
        PRINT'PRINT ''Compression completed on - '+ @table_name +''''
        PRINT''
    END

    IF@type_desc ='NONCLUSTERED COLUMNSTORE'
    BEGIN
        PRINT'/****************************************************************************************'
        PRINT'* Data compression for the table: '+ @table_name
        PRINT'****************************************************************************************/'
        PRINT'ALTER INDEX ['+@index_name +'] ON ['+ @schema_name +'].['+@table_name +'] '
        PRINT'REBUILD WITH ('
        PRINT'        MAXDOP = 16,'
        PRINT'        DATA_COMPRESSION = COLUMNSTORE_ARCHIVE'
        PRINT')'
        PRINT'GO'
        PRINT'PRINT ''Compression completed on - '+ @table_name +''''
        PRINT''
    END

   
    FETCHNEXTFROM CurCompress INTO @schema_name,@table_name, @index_name, @type_desc
END
CLOSE CurCompress
DEALLOCATE CurCompress

References:

Data Compression

Data Compression: Strategy, Capacity Planning and Best Practices

ALTER INDEX (Transact-SQL)

SQL Server Data Compression – Beauty or Beast?


Various sources of I/O issues

$
0
0
To achieve a reasonably good performance from SQL Server implementations, careful planning of the I/O subsystem and applying all good practices is crucial. At the beginning of a database application life cycle, I/O issues are undetectable as the application runs against a smaller database. As databases grow, database server performance issue starts being noticed. Tackling these issues later down the road is definitely unproductive and a cumbersome process.

Latency Measurement:
If an application is designed optimally and the I/O subsystem is configured correctly, then Microsoft has a very good recommendation about the I/O latency. These recommendations are well accepted by all the industries experts and can be evaluated against OLTP or DSS implementation (Microsoft TechNet source). Please note that the acceptance level of I/O Latency would slightly vary based on some factors such as random, sequential, and I/O size (8K, 64K, 128K, etc.).

PerfMon Counter
Threshold Value
Data or Log
Type of workload
Average Disk/sec Read & Average Disk/sec Write
1ms - 5ms
Log

4ms - 20ms
Data
OLTP
30ms or less
Data
DSS

I/O measurement and using PerfMon:
There are several performance counters and different technique existing that can be used to measure I/O performance, latency and IOPS. Following are some widely used Windows PerfMon counters that are trustworthy.

Measuring of disk latency:
·         Average Disk sec/Read
·         Average Disk sec/Write
·         Average Disk sec/Transfer

Measuring disk throughputs:
·         Disk Read Bytes/sec
·         Disk Write Bytes/sec
·         Disk Bytes/sec

Measuring IOPS:
·         Disk Reads/sec
·         Disk Writes/sec
·         Disk Transfers/sec

Measuring a I/O requests if it splits into multiple requests:
·         Split IO/Sec

When is a disk overwhelmed? Usually when the disk throughput increases, latency also increases more or less. However, when the disk throughput remains almost the same but the latency increases as time passes, it results in disk saturation or I/O bottleneck.

Source of I/O Issues:
There are numerous reasons why a disk experiences bottleneck on a SQL Server. Following are some handful factors:

·         Inadequate memory for the buffer pool.
·         Index fragmentation.
·         Outdated statistics.
·         Improper or non-optimal fill factor.
·         Not using data compression (enterprise edition only).
·         No isolation of Index, Data and Log files.
·         Structure of database schema such as indexes, row width, data types.
·         Not using T-SQL performance based Set-Base technique.
·         Using nested views.
·         Excessive sort operation such as ORDER BY and GROUP BY.
·         Using Implicit Transaction.
·         Using lengthy Transaction.
·         Excessive using of NOLOCK hints.
·         Using CURSOR method.
·         Lack of covering indexes.
·         Using wider key for clustered index.
·         Workload nature - READ oriented vs. WRITE oriented.
·         Non optimal RAID configuration.
·         Volume alignment (also known as sector alignment).
·         NTFS Block size (also known as cluster size or Allocation Unit Size).
·         Suboptimal drivers or firmware used on the host HBAs or storage array.
·         Improper queue depth settings on HBAs.
·         Incorrectly configured multipath software and/or fiber switches.

Using and detecting I/O Issues using my tool:
In my tool, “I/O Response (ms)” represents the overall “I/O Latency” on a SQL Server Instance. The calculation method includes all the drives where data files are placed. The T-SQL code which has been used to calculate the “I/O Response (ms)” in my tool has been extracted from the SSMS “Activity Monitor”. There may be a fraction of a millisecond calculation variation but it will provide you the most critical current I/O and workload state.

Figure#1: Overall I/O Response (ms)

Under the “Database” tab, there is a “Database I/O” tab which calculates I/O operations which has been derived from “sys.dm_io_virtual_file_stats”. This will provide you with a far more granular and drill-down information about I/O which are occurring on various data and log files. To use this feature, multiple clicks on the lightning bolt button are required to activate and to view the current I/O performance data.

Figure#2: I/O Operation on Data and Log files

Read Gurus Articles:
Are I/O latencies killing your performance?

SQL Server Best Practices Article

PowerShell Way: Backing up numerous databases (Full, Differential, Transaction Log) on numerous SQL Server Instances concurrently and intelligently

$
0
0
Do you want to back up databases on multiple servers simultaneously from a central server without deploying any code with an edge of efficiency and in an intuitive way? The purpose of this PowerShell Process development initiative is to backup hundreds of databases that reside on hundreds of database servers with different backup strategies.

Brief description of the Script:
The PowerShell function “Do_dbBackup” in the script is a work-flow type function and it utilizes multi-threading mechanism of the PowerShell Process. It requires two input parameters: one is a list of database servers which contains server information along with various backup options and another is error output file for error logging.

Following are some highlights of this process:
1.      Performing Full or Differential backup.
2.      Dumping the backup files to a local or network shared folder.
3.      Will create a folder automatically if it does not exist.
4.      Deleting old backups file based on retention period.
5.      Utilizing backup compression for Enterprise Edition.
6.      Error handling, logging and notification.
7.      Performing system database backups.
8.      Differential or T-Log backup will not happen if there is no prior full backup of a database.

Parameters found in the configuration file are adjustable to fit a specific requirement. This parameter file can be used for backing up a Transaction Log as well.

How to use the Script?
The script assumes that the executer (i.e. the domain account) of this script has permission to access all target database servers as “sysadmin” and has read\write permission for the Windows drive, Local folder or network shared folder.

The PowerShell script “DBBackupV2.ps1” contains the main function “Do_dbBackup” and it accepts two parameters as follows:

1.      $ServerListPath= list of database instances along with various options
2.      $ErrorLogFile= Error logging file

At the bottom of the script, the “Do_dbBackup” is called as follows:

$DBConfigFile="D:\Work2016\PSScript2016\DBBackupV1\ServerList.txt"
$LogFile='D:\Work2016\PSScript2016\DBBackupV1\ErrorLog.txt'

Invoke-Command-ScriptBlock{ Do_DBBackup-ServerListPath$DBConfigFile-ErrorLogFile$LogFile }

How to execute the Script?
The “DBBackupV2.ps1” or the “LogBackupV1.ps1” can be executed either by a Windows Task, by a SQL Server Agent or manually. Here is a simple example of using the SQL Server Agent to execute the script.


 Description of parameters:
The “ServerList.txt” is a CSV type file which can hold several database instances and corresponding  configuration options for each server. The Header of the CSV is the following.

BackupYesNo, Description, SQLInstance, FullBakPath, DiffBakPath, TLogBakPath, SysBakPath, FullBakRetentionHour, DiffBakRetentionHour, TLogBakRetentionHour, SysBakRetentionHour, day1, day2, day3, day4, day5, day6, day7

·         The first row represents the header of each column.
·         The column “BackupYesNo” is for whether a database backup will be performed or not. Value is “Yes” or “No”
·         The second column “Description” is for Database Server description. e.g. “Payment Processing Server”
·         The Third column is for SQL Server Instance name.
·         FullBakPath, DiffBakPath, TLogBakPath, SysBakPath column represents the destination folder of backup.
·         FullBakRetentionHour, DiffBakRetentionHour, TLogBakRetentionHour, SysBakRetentionHour represents the backup retention hours respectively.
·         day1, day2, day3, day4, day5, day6, day7 represents the day name and backup type. The format should be similar to Sunday\FULL, Monday\Full, Tuesday\Full, Wednesday\DIFF, Thursday\Full, Friday\Full, Saturday\DIFF

Transaction Log Backup:
The “Do_LogBackup” in the “LogBackupV2.ps1” Scripts uses the same configuration file; however, the job needs to be scheduled in regular intervals. The process also creates folder automatically if required and deletes old t-log backup files.

Download Link:

Script download link: http://bit.ly/2aSTbhz

The shared link contains two scripts: one for Database backup and another for Log backup. Download then extract all three files in a folder. Change the CSV file path and adjust configuration parameters according to your needs.


Review this script, test it and enhance it to incorporate your own ideas and requirement. 

Using SQL with MongoDB – the “Aqua Data Studio” from www.aquafold.com

$
0
0
MongoDB is the most popular and highly ranked in the NoSQL database world. It has a flexible architecture and a very fast query execution mechanism with the support of in-memory computations. Mongo storage follows a JSON based architecture and JavaScript based programing language.

Aqua Data Studio for MongoDB:
There are a number of commercial and non-commercial tools available for MongoDB. The “Aqua Data Studio” from the developer of www.aquafold.com is one of the most versatile tools that provide numerous flexibilities and has many intuitive features with a very easy to use GUI mechanism which helps to perform various kinds of database related activities. It natively supports more than 28 different heterogeneous databases and runs on Windows, Mac and Linux. Therefore, it becomes easily possible to administer, analyze and visualize data from a single application.

SQL vs JavaScript in MongoDB:
Those who have gotten their hands dirty from writing SQL and can’t think of getting rid of SQL but still want to use SQL with MongoDB will appreciate utilizing “Aqua Data Studio”. MongoDB uses JavaScript programming language and JSON to perform data analysis as well as administering database servers, therefore, there is a very little learning curve. However, many of us like to utilize SQL like syntax instead of JavaScript against MongoDB databases.

Using both SQL and JavaScript against MongoDB with Aqua Data Studio:
 “Aqua Data Studio” gives us the flexibility to use either pure JavaScript based query or SQL like syntax. Let’s say we have a MongoDB collection named “master_data_sql” in which we store various SQL Server events collected from hundreds of database servers. Now the next step is to analyze the collection to answer any specific questions that we may have either on a daily basis or ad-hoc basis.

MongoDB Sample collection:

From the above MongoDB schema, following are some simple queries  from both JavaScript and SQL to demonstrate the similarity. All queries were executed and tested with MongoDB V3.4 and “Aqua Data Studio v17.0”.

Query Comparison #1:
Find all entries if the message column contains ‘Login failed’.

MongoDB:db.master_data_sql.find({message: /Login failed/i })
SQL:SELECT * FROM master_data_sql WHERE     message LIKE '%Login failed%'

Query Comparison #2:
Find all entries if the “event_type” column contains ‘Login failed’ and DBCC.

MongoDB:db.master_data_sql.find({event_type: /Login Failed|DBCC/i })
SQL: SELECT * FROM master_data_sql WHERE     event_type LIKE 'Login Failed'OR event_type LIKE 'DBCC'

Query Comparison #3:
Find all entries if the event_type column contains ‘Login failed’ and DBCC, display only three columns “event_date”, ”event_type” and “message”.

MongoDB:db.master_data_sql.find({event_type: /Login Failed|DBCC/i},
                        {event_date:1, event_type:1, message:1,_id:0} )
SQL:SELECT event_date, event_type, message FROM master_data_sql WHERE  event_type LIKE 'Login Failed'OR event_type LIKE 'DBCC'

Query Comparison #4:
Find all entries if the “event_type” column contains ‘Login failed’ and DBCC; event_date is equal to ‘11/23/2016’, display only three columns “event_date”, ”event_type” and “message”.

MongoDB:db.master_data_sql.find({event_date:'11/23/2016', event_type: /Deadlock|DBCC/i},
                        {event_date:1, event_type:1, message:1,_id:0} )
SQL:SELECT event_date, event_type, message FROM master_data_sql
                WHERE event_date ='11/23/2016'
   AND (event_type LIKE 'Deadlock'OR event_type LIKE 'DBCC')
  

Query Comparison #5:
A group by example.

MongoDB:
db.master_data_sql.aggregate
([
   { $match: { event_type: {$in: ["Login Failed"]}, event_date: {$gte: "11/12/2016", $lte: "11/18/2016"} } },
   { $group: { _id: { event_date: "$event_date",  event_type: "$event_type" }, total: {$sum: 1} }},
   { $project: { event_date: "$_id.event_date", event_type: "$_id.event_type", total: "$total", _id: 0} },
   { $sort: { event_date: 1, total: -1  }}
])

SQL:
SELECT
        ms.event_date,
        ms.event_type,
        COUNT(event_type) AS total
FROM
        master_data_sql AS ms
GROUP BY
        ms.event_date,
        ms.event_type
HAVING
        (ms.event_date >= '11/12/2016'AND
        ms.event_date <= '11/18/2016') AND
        event_type IN ('Login Failed')
ORDER BY
        ms.event_date,
        ms.total DESC

Figure Side by side output from the Aqua Data Studio:


Query Comparison #6:
Another group by example.

MongoDB:
db.master_data_sql.aggregate
([
   { $match: {event_date:  "12/07/2016"} },
   { $group: {_id: { event_date: "$event_date", host_server: "$host_server",
                       host_description: "$host_description",
                       event_type: "$event_type" }, total: { $sum: 1 }} },
   { $project: { event_date: "$_id.event_date", host_server: "$_id.host_server",
                       host_description: "$_id.host_description",
                       event_type: "$_id.event_type", total: "$total", _id: 0 }},
   { $sort: {  total: -1, event_type: 1} }  
])

SQL:
SELECT
        ms.event_date ,
        ms.host_server,
        ms.host_description,
        ms.event_type,
        COUNT(ms.event_type) AS total
FROM
        logdb.master_data_sql ms
GROUP BY
        ms.event_date,
        ms.host_server,
        ms.host_description,
        ms.event_type
HAVING
        (ms.event_date = '12/07/2016')
ORDER BY
        ms.total DESC,
        ms.event_type ASC

Figure Side by side output from the Aqua Data Studio:


Dashboard for data visualization:

To learn more visit:
Aqua Data Studio: http://www.aquafold.com/


Golden Gate Latency monitoring with PowerShell, influxDB and Grafana – PowerShell to InfluxDB

$
0
0
The SQL Server which is installed on the Windows Server is receiving data from “Tandem Non-Stop System” by using Oracle Golden Gate replication. This downstream data feed is critical to smooth business functionality. So, it needs to be monitored proactively.

Although monitoring this environment is critical, however, by executing various Golden Gate commands (STATUS ALL, INFO ALL, LAG) in the GGSCI shell manually to understand Latency is very annoying and tedious. Therefore, the automated process comes into the picture to monitor performance in real-time for our die-hard operational team.

Two REPLICATs we are interested in:
We are interested in monitoring two of the REPLICATs’ performance constantly as they are critical to our healthcare business activities along with some SQL Server and Windows performance counters.

The following dashboard has been developed with the open source technology to visualize performance data in real-time so one can glue his/her eyes 24/7 on the dashboard. The dashboard process (the Grafana) can also trigger alerts/notifications if a particular monitoring object exceeds the threshold for a substantial period of time.

Performance metrics dashboard in Real-time:


Technology Stack Used:
The PowerShell script streams data in every 10 seconds interval and sends it to influxDB using the REST API method. The script runs by the windows Task scheduler continuously.

InfluxDB is a time-series based database technology which is high performance and can be massively scaled up. It is written in GO language and is open source.

Grafana is an open source metric analytics & visualization suite. It is most commonly used for visualizing time series data for infrastructure and application analytics.

PowerShell Script and Dashboard download:

PowerShell Script:
Following is the complete PowerShell Script which is feeding data into influxDB. This script collects two Golden Gate REPLICATs’ latency, as well as couples SQL Server and Windows Performance metrics every 10 seconds.  Where, in the script, the server represents the following:

SRV0009– the Windows server where the Golden Gate process is running. The PowerShell Script is also hosted here.
STV1075– where the InfluxDB and the Grafana have been installed and are running.

<#####################################################################################
       .NOTES
       ===========================================================================
        Created with:      PowerShell ISE
        Created on:        12/25/2016 9:39 AM
        Created by:        Sarjen Haque
       ===========================================================================
       .DESCRIPTION
              function to collect and parse Golden Gate status data from
              a local or remote server installed on Windows
######################################################################################>

functionGet-RealTimeStatus()
{
       $result=winrs-r:SRV0009"CMD /c echo status all | H:\OracleGoldenGate\ggsci"
       $raw=$result-match'REPLICAT'
      
       [StringSplitOptions]$Options="RemoveEmptyEntries"
      
       # loop through each line and break
       foreach($linein$raw)
       {
              $wrd=$line.Split("",$Options)
              $lg=$wrd[3].Split(":")
              $tm=$wrd[4].Split(":")
              $result= @{
                     "Program"=$wrd[0];
                     "Status"=$wrd[1];
                     "Name"=$wrd[2];
                     "Lag"=$wrd[3];
                     "LagSec"=[int]$lg[0]/(60*60) +[int]$lg[1]/60+[int]$lg[2];
                     "ChkPt"=$wrd[4];
                     "ChkPtSec"=[int]$tm[0]/(60*60) +[int]$tm[1]/60+[int]$tm[2];
              }
             
              $obj=New-Object-TypeNamePSObject-Property$result
              Write-Output$obj
       }
}

#######################################################################################
# FUnction to collect and format Golden gate and Windows/SQL Server PerfMon data
#######################################################################################

FunctionGet-ggPerf
{
       # Windows and SQL Server Instance
       $WinServer='SRV0009'
       $SQLServer='SQLServer'# use for default instance
       # $SQLServer = 'MSSQL$SQL2014' # use for a named instance. Replace SQL2014 with the isntance name
      
       # Pull Windows and SQL stats
       [System.Collections.ArrayList]$counters=@()
      
       # Windows reelated metrics
       $counters.Add("\\$WinServer\logicaldisk(d:)\avg. disk sec/transfer") |out-null#0
       $counters.Add("\\$WinServer\logicaldisk(e:)\avg. disk sec/transfer") |out-null#1
       $counters.Add("\\$WinServer\logicaldisk(h:)\avg. disk sec/transfer") |out-null#2
       $counters.Add("\\$WinServer\logicaldisk(l:)\avg. disk sec/transfer") |out-null#3
       $counters.Add("\\$WinServer\logicaldisk(_total)\avg. disk sec/transfer") |out-null#4
       $counters.Add("\\$WinServer\Memory\Available MBytes") |out-null#5
       $counters.Add("\\$WinServer\Processor(_total)\% Privileged Time") |out-null#6
       $counters.Add("\\$WinServer\Processor(_total)\% User Time") |out-null#7
       $counters.Add("\\$WinServer\Processor(_total)\% Processor Time") |out-null#8
      
       #SQL Server related metrics      
       $counters.Add("\\$WinServer\"+$SQLServer+":Resource Pool Stats(default)\CPU usage %") |out-null#9
       $counters.Add("\\$WinServer\"+$SQLServer+":General Statistics\Processes blocked") |out-null#10
       $counters.Add("\\$WinServer\"+$SQLServer+":Buffer Manager\page life expectancy") |out-null#11
       $counters.Add("\\$WinServer\"+$SQLServer+":General Statistics\User Connections") |out-null#12
       $counters.Add("\\$WinServer\"+$SQLServer+":SQL Statistics\Batch Requests/Sec") |out-null#13
       $counters.Add("\\$WinServer\"+$SQLServer+":Memory Manager\total server memory (kb)") |out-null#14
       $countersall= (Get-Counter-Counter$Counters-SampleInterval1).countersamples.CookedValue
      
       # Format SQL data into Influxdb Line Protocol
       $postParams="sql_perf,host="+$WinServer+" avgtransfer_d="+$countersall[0]+",avgtransfer_e="+$countersall[1] `
                     +",avgtransfer_h="+$countersall[2]+",avgtransfer_l="+$countersall[3] `
                     +",avgtransfer_total="+$countersall[4]+",available_mbytes="+$countersall[5] `
                     +",pct_priviledge_time="+$countersall[6]+",pct_user_time="+$countersall[7] `
                     +",pct_processor_time="+$countersall[8]+",sql_cpu_time="+$countersall[9] `
                     +",processess_blocked="+$countersall[10]+",page_life_expectancy="+$countersall[11] `
                     +",user_connections="+$countersall[12]+",batch_resc_per_sec="+$countersall[13] `
                     +",total_server_memory_kb="+$countersall[14]
      
       # get the output from the Golden Gate function
       $result=Get-RealTimeStatus|selectProgram,Status,Name,Lag,LagSec,ChkPt,ChkptSec
       $r1=$result|?{ @("RP9CRIT2") -contains$_.Name } |select-First1
       $r2=$result|?{ @("RP9MAIN2") -contains$_.Name } |select-First1
      
       if ($r1.Status -eq 'RUNNING') { $r1status=1 }
              else{ $r1status=0 }
      
       if ($r2.Status -eq 'RUNNING') { $r2status=1 }
              else{ $r2status=0 }
      
       # Format GG data into influxdb Line Protocol
       $postParams_r1="gg_RP9CRIT2,host="+$WinServer+" LagSec="+$r1.LagSec +",ChkptSec="+$r1.ChkptSec +",Status="+$r1status
       $postParams_r2="gg_RP9MAIN2,host="+$WinServer+" LagSec="+$r2.LagSec +",ChkptSec="+$r2.ChkptSec +",Status="+$r2Status
      
       # Post to influxdb API
       $uri='http://SRV0175:8086/write?db=ggperfdb'
      
       # Create web connection with influxdb URL
       $ServicePoint=[System.Net.ServicePointManager]::FindServicePoint($uri)
       $ServicePoint.ConnectionLimit =3
      
       # Use influxdb authentication to logon
       $authheader="Basic "+ ([Convert]::ToBase64String([System.Text.encoding]::ASCII.GetBytes("admin:admin")))
      
       # Post data to influxDB
       try
       {
              Invoke-RestMethod-Headers @{ Authorization =$authheader} -Uri$uri-MethodPOST-Body$postParams-DisableKeepAlive
              Invoke-RestMethod-Headers @{ Authorization =$authheader} -Uri$uri-MethodPOST-Body$postParams_r1-DisableKeepAlive
              Invoke-RestMethod-Headers @{ Authorization =$authheader} -Uri$uri-MethodPOST-Body$postParams_r2-DisableKeepAlive
             
              #Close web connection
              $ServicePoint.CloseConnectionGroup("") |Out-Null          
       }
      
       catch
       {     
              throw'Could not POST to InfluxDB API endpoint'            
       }
}

#######################################################################################
# Run the collector function in a loop, continuously 
#######################################################################################

while ($true)
{
       # execute the collector
       Get-ggPerf
       # pause for X seconds
       start-sleep-Seconds8
}

# end of script 

References:
PowerShell Way: Automating Golden Gate Replication Monitoring on Windows
http://sqltouch.blogspot.ca/2014/08/powershell-way-automating-golden-gate.html


Grafana: http://grafana.org/


Deployment of Telegraf Agent on multiple Windows Servers – deploy Telegraf Agent with PowerShell

$
0
0
During the development of performance metrics visualization projects in real-time, we have made a few changes to deploy the performance metric collector agent (Telegraf.exe) on multiple Windows Servers. In the development and testing phase, we often approach new ideas and metrics requirements, so the configuration of Telegraf agent changes often. To reflect those changes, the configuration file needs to be re-deployed again and Agent service needs a restart.

Another challenge is that we need to deploy the agent onto multiple servers without performing RDP to the remote server. Every time the Telegraf configuration is updated for any reason, the Telegraf configuration file needs to be replaced with changes on the remote server too. The Telegraf service needs to be restarted with the new configuration file for those changes to take effect.

So, we developed a PowerShell based deployment Script to perform the entire task on a remote Windows Server regardless of the number of Servers.

Suitability of this deployment Script:
There are many applications of this automated deployment script on a remote server.
1.      New deployment of the Telegraf agent.
2.      Upgrading the Telegraf agent.
3.      Restarting/Stopping/removing the Telegraf agent.
4.      Updating “telegraf.conf” file.
5.      Deploying an updated version of the Telegraf agent.
6.      Changing the Telegraf Agent’s data posting URL, and so on.

The provided script can be changed and enhanced according to your specific needs.

The dashboard search requirements:
Following is the dashboard we have developed to monitor more than 300+ production SQL Servers in real-time. To identify a server, we have a filter mechanism on the Grafana UI so that a user/viewer can bring a specific server into viewing. In Grafana, it is called “Grafana Templating”. To do this, we created three templating variables which are “Server”, “AppEnv” and “App”.

Figure: the SQL Server Dashboard:

The section “global_tags” of the configuration file “telegraf.conf” of Telegraf Agent “Telegraf.exe” needs to be changed for each server and needs to be placed in the remote server so the Telegraf Agent can read the specific configuration associated with this server and send the data to InfluxDB.

The telegraf “telegraf.conf” file:
The Telegraf “telegraf.conf” file has a specific section known as [global_tags] which contains Key = “Value” format data. In our case, the “telegraf.conf” file has been renamed as “telegraf.baseconf” with the following dummy tag name and from this template configuration file we will derive the required “telegraf.conf” for deployment.

[global_tags]
Appenv="AppEnvName"
App="AppName"

The PowerShell Script will read each key and will then change according to the passing server parameters which comes from a predefined CSV file. The components of the CSV file looks as follows:

"Server","AppEnv","App"
"FIN001", "Finance", "Budget Reconciliation Application"
"FIN002", "Finance", "Payment Disbursement"
"HR0101", "HR", "Employee Performance"
"HR0102\SQL2014", "HR", "Vendor Management"
"HR0103", "HR", "CRM portal"
"HR0201\SHARE2013","HR", "HR SharePoint"
"HR0201","HR", "Insight the Organization"

PowerShell Script:
The powerShell scripts “TelegrafDeployV3.ps1” has two functions:

Correct-SQLPerf
Deploy-Telegraf

Script download Link:

“Correct-SQLPerf”:
The “Correct-SQLPerf” is to correct any missing performance counters on a SQL Server instance. It has only one parameter which is “$SQLServer”. The value can be default or named instance of SQL Server. This function is called automatically by the main function internally. You can also execute it separately.


FunctionCorrect-SQLPerf
{
       [CmdletBinding()]
       param(
              [Parameter(Mandatory =$True)][string]$SQLServer
       )


“Deploy-Telegraf”:
The main function of the PowerShell script is “Deploy-Telegraf” which requires three parameters.

FunctionDeploy-Telegraf
{
       [CmdletBinding()]
       param(
              [Parameter(Mandatory =$True)][string]$SourceFolder,
              [Parameter(Mandatory =$True)][string]$DeployType,
# N = New deployment, U = update existing, R= remove everything
              [Parameter(Mandatory =$True)][string[]]$SeverList
       )
        

$SourceFolder is the local folder from where the telegraf will be deployed.
$DeployType is the option for deployment type.
$SeverList Is the list of Server. The format of this column is “WindowsServerName\SQLInstanceName”

How to deploy?
Make sure that the WInRM Service is running on the Remote server. To deploy Telegraf onto one or multiple remote servers, do the following:

1.      The Script will create a folder called “C:\PerfMonSQL” on a remote computer.
2.      Create a folder on your local desktop, such as “D:\TelefragDeploy”.
3.      Copy the “telegraf.exe” into this folder.
4.      Create a text file “serverList.txt” (CSV) with a list of servers, application environment and application name. An environment can have multiple applications and an application may have one or more servers.
5.      Copy the telegraf “telegraf.conf” as “telegraf.baseconf” into this folder.
6.      Edit the “telegraf.baseconf” and add the tags as appenv=”AppEnvName” and app=”AppName”.

The “D:\TelegrafDeploy” folder should contain the following items:


Execute the Deployment Script:
To execute the deployment script, open PowerShell ISE with administrator privileges. Open the PowerShell Script “DeployTelegraf.ps1”. Change the three parameters according to your needs and settings.

Example of Running the Deployment Scripts:

To deploy Telegraf Agent on a Remote Windows Server:

# Deploy telegraf for the first time on a (or multiple) remote server
Deploy-Telegraf-DeployType"N"`
                           -SourceFolder"D:\TelegrafDeploy\"`
                           -SeverList"D:\TelegrafDeploy\ServerList.txt"

# Remove telegraf from a (or multiple) remote server
Deploy-Telegraf-DeployType"R"`
                           -SourceFolder"D:\TelegrafDeploy\"`
                           -SeverList"D:\TelegrafDeploy\ServerList.txt"

# Upgrade telegraf on a (or multiple) remote server
Deploy-Telegraf-DeployType"U"`
                           -SourceFolder"D:\TelegrafDeploy\"`
                           -SeverList"D:\TelegrafDeploy\ServerList.txt"


To correct missing SQL PerfMon counters:

#Correct SQL Server missing Perfmon counter
Correct-SQLPerf-SQLServer"SHB_MAIN\SQL2016"# this for named instance of SQL Server
Correct-SQLPerf-SQLServer"SHB_MAIN"# this for default instance of SQL Server


Read and Learn More:
Telegraf and InfluxDB: https://www.influxdata.com/

Golden Gate Latency monitoring with PowerShell, influxDB and Grafana – PowerShell to InfluxDB


The fastest and agentless performance data collector with Dashboard for Windows and SQL Server

$
0
0
PerfCollector:
PerfCollector provides thorough insight into Windows and SQL Server performance data in real-time combined with extreme reliability and accuracy.  Data collection process is light-weight, blazing fast and efficient. It is designed to collect more than 200 crucial performance metrics from multiple servers remotely. You will have the remarkable ability to monitor any server in real-time and to analyze the health status of any Windows and SQL Server instance at any given time.

The performance metrics collector process (PerfCollector.exe) is a command line executable and it is a native machine code; it is smaller, faster and has no dependencies. And of course, it has nearly no impact on the monitored server while collecting metrics data.

Some potential uses of this tool:

1.      Real-time performance monitoring and research.
2.      Historical performance data review and trend analysis.
3.      Load testing of Windows and SQL Server.

Download Link:
Version 1.2 - April 2017

The zipped files contain the following:
1.      How-To guide,
2.      Three dashboards for Grafana,
3.       PerfCollector.exe along with the license file.

Sample Dashboard:


What is PerfCollector?
PerfCollector is a WMI and T-SQL based metrics data collection process written in Free Pascal. It has no external dependencies and can be executed on any Windows OS without configuring and deploying to a remote server.

What does PerfCollector do?
It collects a predefined set of metrics data in a regular user defined interval (for example every 5 seconds) from one or more servers running on either Windows 2003 and above or SQL Server 2005 and above. Data collection can be performed remotely and the collection method is completely agentless and configuration free.

The collected data will be written sequentially to an influxDB (www.influxdata.com) database, which is one of the fastest Open Source Time Series Database.

How to use PerfCollector?
On the command prompt, simply execute the “PerfCollector.exe”, “PerfCollector.exe ?”, “PerfCollector.exe /?” or “PerfCollector.exe Help”. It will show the syntax and examples on how to use the performance collector.

Command line Syntax:
PerfCollector has a number of parameters, some are mandatory and some are optional. The following is the syntax and parameters of PerfCollector.:

Syntax:
PerfCollector.exe [WinServer\SQLServer] [Milliseconds] [Influxdb Server:Port] [InfluxDB]\[Print] [WIN][SQL] ["Environment Tag\Application Tag"].
Where each argument represents the following:

PerfCollector.exe is the name of the executable.

[WinServer\SQLServer] is the target Windows Server along with the SQL Server named instance. For a default instance of SQL Server providing the parameter value of “SQLServer”, the instance name is not required.

[Milliseconds] is the data collection interval. The recommended interval is 5000 milliseconds however it can be as low as 100 milliseconds.

[Influxdb Server:Port]represents the InfluxDB Server name along with the port number.

[InfluxDB]\[Print] is the database name of influxDB. [Print] is optional for displaying collected data on the console window. Please note that the database name is case sensitive.

[WIN][SQL] is the type of metrics data PerfCollector will collect from a target Server. If “WIN” is specified, then the PerfCollector collects only Windows Performance metrics. If “SQL” is specified, then the PerfCollector collects Windows and SQL Server Performance metrics. If nothing is specified, the PerfCollector will collect Windows metrics by default.

["Environment Tag\Application Tag"] is the tag to identify a target server. The ‘Environment Tag’ will be used for the environment that the target server belongs to and the ‘Application Tag’ is the name of the application that the target server is serving. One or both can be specified.

Example of using PerfCollector command line tool.
The InfluxDB has been installed on “SrvInFlux201” and the port of the influxDB is 8086. We would like to collect data from two Windows Servers (WinFin001, HLT092) and three SQL Server instances where one SQL Server is a named instance (FinSrv1092, HR093, SrvGE981\SQL2014). Streaming data will be then inserted into an influx database: “metricsdb”. The following are various ways we can collect data from each server:

Data Collection - Windows Only:
(a)    Collect Windows metrics every 2 seconds and insert collected data into metricsdb.

PerfCollectorexe WinFin001 2000 SrvinFlux201:8086 metricsdb

(b)   Collect Windows metrics every 5 seconds and insert collected data into metricsdb. Add Server identification with tag.
PerfCollectorexe WinFin001 5000 SrvinFlux201:8086 metricsdb Win “Production\Finance”

(c)    Collect Windows metrics every second and insert collected data into metricsdb.
PerfCollector.exe HLTSrv62 1000 SrvinFlux201:8086 metricsdb Win “Production\Health watch System”

Data Collection – Windows and SQL Server:

(a)    Collect Windows and SQL Server metrics from FinSrv1092 where SQL Server has been installed as a default instance. Insert data into influx database without tag.
PerfCollector.exe FinSrv1092 5000 SrvinFlux201:8086 metricsdb SQL

(b)   Collect Windows and SQL Server metrics from FinSrv1092 where SQL Server has been installed as a default instance. Insert data into influx database with tag.
PerfCollector.exe FinSrv1092 5000 SrvinFlux201:8086 metricsdb SQL “HR\Employee CRM”.

(c)    Collect only Windows metrics from FinSrv1092 without SQL Server metrics, though, SQL Server has been installed as a default instance. Insert data into influx database with tag.
PerfCollector.exe FinSrv1092 5000 SrvinFlux201:8086 metricsdb Win “HR\CRM Management”.

(d)   Collect Windows and SQL Server metrics from SrvGE981, where SQL Server has been installed as a named instance (SQL2014). Insert data into influx database with tag.
PerfCollector.exe SrvGE981\SQL2014 5000 SrvinFlux201:8086 metricsdb       SQL“GEO\Geographic Survey App.

Permission to Run PerfCollector:
PerfCollector only supports AD Accounts to collect metrics data. The AD Account which is used to execute PerfCollector.exe needs appropriate permission on the target (or remote) Windows and SQL Servers.

(a)   To collect Windows Server Metrics: WMI Read permission on the target (remote) Windows Server.
(b)   To collect SQL Server Metrics: VIEW SERVER STATE and SELECT permission on master and msdb database on the target (remote) SQL Server.

To collect SQL Server metrics data, both WMI and SQL Server permission is required.

Connectivity testing for data collection process from a Target Server:
The data collection process can be tested without having influxDB installed. To test the connectivity and to display the collected metrics on the screen for a remote server, for example “WinSrv2016” or “DellSRV016”, execute any of the following commands:

Connectivity Test - Windows:
C:\Metrics\PerfCollector.exe WinSrv2016 1000 NoServer:NoPort NoDB\Print WIN
Connectivity Test - SQL Server:
C:\Metrics\PerfCollector.exe DellSRV016 1000 NoServer:NoPort NoDB\Print SQL

Collecting real-time metrics data Using Windows Task Scheduler:
To collect metrics data from multiple remote servers, Windows Scheduler Task can be used seamlessly. A Multiple Windows Scheduler task needs to be created to collect data from multiple servers. The AD Account which will be executing each task must have WMI and SQL Server permission on the target server:

1.      Security option: Make sure that the option “When running the task, use the following account” for the Windows Account which executes the PerfCollector has WMI and SQL Server access permission on the target/remote server.
2.      Create a Windows Scheduler Task with the following options:
(a)      “Run whether user is logged on or not”;
(b)     “Run with highest privileges”;
(c)      “Hidden” and
(d)     “Configure for:” choose the preferable server option.
3.      In the “Edit Action”, input the following information:
(a)      Insert the location along with the PerfCollector.exe. Example:

C:\PerfCollector\PerfCollector.exe

(b)     “Add arguments (optional)”: Insert all the parameters without the executable name. Example: SrvGE981\SQL2014 5000 SrvinFlux201:8086 metricsdb SQL “GEO\Geographic Survey App”.

(c)      “Start in (optional)”, insert the location of the executable.

4.      Schedule the task to run every XXX minutes, and make sure “Do not run a second instance” from the Settings of the task has been selected.
5.      You may consider choosing “disable all task history” for smaller task histories.

False positive Alert of Anti-Virus:
You may receive a False Positive Warning from select Anti-Virus software. In that case, you may consider excluding the executable file (PerfCollector.exe) from being scanned.

License and Execution Restriction:
There are three different license modes of the PerfCollector. Regardless of the licensing mode, PerfCollector will always collect real-time metrics data:

1.      Self-Generated License: When the PerfCollector runs for the first time and if no license file has been found in the folder, it will generate a self-license which can be used to collect metrics data from only one local or remote machine for 30 days. After 30 days, PerfCollector will stop collecting all metrics data. You may delete the existing license file (PerfCollector.lic), then re-run the PerfCollector.exe which will cause a new license to generate for another 30 days.

2.      Courtesy License: The license already provided with the PerfCollector will be able to collect metrics data from 5 remote servers for 30 days. After 30 days, PerfCollector will stop collecting all metrics data.

3.      HOST based License: This type of license is specific for a Host and can collect metrics data from any number of servers for an unlimited time. However, this license can’t be used on a different Host.

4.      Enterprise License: This type of license can be used on any host for any number of target remote servers without any time limitations. With this license, PerCollector.exe can be used on any server that resides in the domain.

InfluxDB and Grafana Installation and importing dashboard:


Using PerfCollector with InfluxDB and Grafana

$
0
0
Using PerfCollector with InfluxDB and Grafana:
To collect Windows and SQL Server performance metric data, the following steps needs to be completed:

1.       Install InfluxDB from www.influxdata.com and run it as a service.
2.       Create a database named metricsdb.
3.       Install Grafana from www.grafana.com and run it as a service.
(a)    Create data source as metricsdb for PerfCollector.
(b)    Import the pre-designed dashboard.
4.       Create a Windows Scheduler Task to run PerfCollector continuously.


Installation of InfluxDB:
Currently PerfCollector utilizes InfluxDB for data storage. This guide will help you install InfluxDB on a Windows environment. Please note that the InfluxDB can be install on different OS. Please see  www.influxdata.comfor more details.

In this guide, we will install influxDB as a Windows Server Service:

1.       Download the latest pre-build Windows version of influxDB from www.influxdata.com.
2.       Create a folder, for example, d:\influxdb
3.       Extract the binaries into this folder.
4.       Navigate to the d:\influxdb folder.
5.       Create three more folders as follows:

d:\influxdb\data
d:\influxdb\wal
d:\influxdb\meta

6.       Open the “influxdb.conf” configuration file with Windows WordPad. Change the following sections as follows:

[meta]
  dir = "d:\\influxdb\\meta"

[data]
  dir = "d:\\influxdb\\data"
  wal-dir = "d:\\influxdb\\wal"

7.       Open an elevated Windows command prompt and then navigate to the folder, d:\influxdb
8.       Run the InfluxDB daemon as follows:
Influxd –config influxdb.conf

Creating a database for PerfCollector:
1.       Open another elevated Windows command prompt.
2.       Navigate to d:\influxdb
3.       Run influx.exe on the command prompt.
4.       While you are in influx shell, create a database with any name of your choice. Please note that the name is case sensitive.
5.       To create a database, execute, CREATE DATABASE metricsdb

Creating a Windows Service for InfluxDB:
To create a Windows Service for InfluxDB, download the open source nssm tool from https://nssm.cc/.
1.       Extract the contents in a folder, for example, d:\app.
2.       Open an elevated Windows command prompt and navigate to d:\app
3.       Execute the following command to create a Windows Service:
d:\app\nssm.exe install influxdb
4.       Fill in the input fields in the dialog box as follows:


5.       Press “Install Service” when done. The nssm will take you back to the command prompt.
6.       Now on the command prompt, execute net start influxdbto start the InfluxDB service.


Installation of Grafana:
To display PerfCollector metrics in-real time, the open source web based metrics visualization tool “Grafana” is highly recommended. We will be using nssm to create a Windows Service for Grafana.

Download the latest Windows build of Grafana from https://grafana.com.
1.       Create a folder, for example d:\grafana
2.       Extract the zipped file to this folder.
3.       Open an elevated Windows Command Prompt and navigate to d:\appfolder.
4.       Execute the following command:
d:\app\nssm.exe install grafana
5.       Fill in the input fields as shown in following dialog boxes:


Importing dashboard into Grafana:
Open a web browser and then browse tohttp://localhost:3000. Use the default username (admin) and password (admin) to login to the Grafana Interface. You will see the following Grafana web interface:


1.       Data Source for PerfCollector: A data source is needed for the dashboard to display real-time metrics. Click the “Add data source” and create a data source for InfluxDB database which is metricsdb.


2.       Import the dashboard: navigate to the Dashboard menu and hit the “Import button” to import a pre-designed dashboard for PerfCollector.


3.       Dashboard: From the import dialog box, browse the dashboard JSON file and fill in the input fields as follows:


 Sample dashboards:


List of Performance Counters for every SQL Server folks

$
0
0
The Remote PerfCollector Agent collects more than 200+ Windows and SQL Server metrics which are crucial for any SQL Server operation. The agent has the ability to collect data within every few seconds from one or more remote servers continuously. The collected data are in two categories: one is Windows specific and the other is SQL Server specific which is seamlessly stored in a Time Series database known as influxDB.

The following table provides each counter name and measurement units. Please note that all SQL Server counters are prefixed with the “SQL” keyword, whereas Windows counters are prefixed with either “cpu”, “disk”, “sys”, “network” or “memory”.

You might be interested in reading the following two articles for easy installation and configuration of “PerfCollector”:

PerfCollector Process:

InfluxDB and Grafana Installation:

Windows Performance Counter:
#
Performance Counter
Collected As
Unit
1
% Processor Time
cpu_PercentProcessorTime
Numeric
2
% User Time
cpu_PercentUserTime
Numeric
3
% Privilege Time
cpu_PercentPrivilegedTime
Numeric
4
% Idle Time
cpu_PercentIdleTime
Numeric
5
Interrupts/sec
cpu_InterruptsPersec
Numeric
6
Processor Queue Length
sys_ProcessorQueueLength
Numeric
7
Context Switches/sec
sys_ContextSwitchesPersec
Numeric
8
Avg. Disk sec/Read
disk_AvgDisksecPerRead
Seconds
9
Avg. Disk sec/Write
disk_AvgDisksecPerWrite
Seconds
10
Avg. Disk sec/Transfer
disk_AvgDisksecPerTransfer
Seconds
11
Disk Writes/sec
disk_DiskWritesPersec
Numeric
12
Disk Reads/sec
disk_DiskReadsPersec
Numeric
13
Disk Transfers/sec
disk_DiskTransfersPersec
Numeric
14
Disk Read Bytes/sec
disk_DiskReadBytesPersec
Bytes
15
Disk Write Bytes/sec
disk_DiskWriteBytesPersec
Bytes
16
Disk Bytes/sec
disk_DiskBytesPersec
Bytes
17
Split IO/sec
disk_SplitIOPerSec
Numeric
18
Bytes Received/sec
network_BytesReceivedPersec
Bytes
19
Bytes Sent/sec
network_BytesSentPersec
Bytes
20
Bytes Total/sec
network_BytesTotalPersec
Bytes
21
Packets Received Errors
network_PacketsReceivedErrors
Numeric
22
Packets Outbound Errors
network_PacketsOutboundErrors
Numeric
23
Output Queue Length
network_OutputQueueLength
Numeric
24
Free Physical Memory
memory_FreePhysicalMemory
KiloBytes
25
Free Virtual Memory
memory_FreeVirtualMemory
KiloBytes
26
Total Virtual Memory
memory_TotalVirtualMemorySize
KiloBytes
27
Total Visible Memory
memory_TotalVisibleMemorySize
KiloBytes
28
Physical Memory Used
memory_PhysicalMemoryUsed
KiloBytes
29
Virtual Memory Used
memory_VirtualMemoryUsed
KiloBytes
30
Physical Memory
memory_PhysicalMemoryGB
GigaBytes
31
% Physical Memory Used
memory_PctPhysicalMemoryUsed
Numeric
32
% Virtual Memory Used
memory_PctVirtualMemoryUsed
Numeric
33
% Virtual Memory Used
memory_PctVirtualMemoryUsed
Numeric
34
Pool Non-paged Bytes
memory_PoolNonpagedBytes
Bytes
35
Pool Paged Bytes
memory_PoolPagedBytes
Bytes
36
Available Bytes
memory_AvailableBytes
Bytes
37
Cache Bytes
memory_CacheBytes
Bytes
38
Commit Limit
memory_CommitLimit
Bytes
39
Committed Bytes
memory_CommittedBytes
Bytes
40
% Committed Bytes in Use
memory_PercentCommittedBytesInUse
Numeric
41
Free And Zero Page List Bytes
memory_FreeAndZeroPageListBytes
Bytes
42
Free System Page Table Entries
memory_FreeSystemPageTableEntries
Numeric
43
Modified Page List Bytes
memory_ModifiedPageListBytes
Bytes
44
Page Faults/sec
memory_PageFaultsPersec
Numeric
45
Page Reads/sec
memory_PageReadsPersec
Numeric
46
Pages Input/sec
memory_PagesInputPersec
Numeric
47
Pages Output/sec
memory_PagesOutputPersec
Numeric
48
Pages/sec
memory_PagesPersec
Numeric
49
Page Writes/sec
memory_PageWritesPersec
Numeric
50
Cache Faults/sec
memory_CacheFaultsPersec
Numeric
51
Page File Size
memory_PageFileSize
Megabytes
52
Page File Current Usage
memory_PageFileCurrentUsage
Megabytes
53
% Page File Usage
memory_PageFilePctUsage
Numeric
54
Page File Free
memory_PageFileFree
Megabytes
55
Avg. Disk sec/Read
disk_[drive]_AvgDisksecPerRead
Seconds
56
Avg. Disk sec/Write
disk_[drive]_AvgDisksecPerWrite
Seconds
57
Avg. Disk sec/Transfer
disk_[drive]_AvgDisksecPerTransfer
Seconds
58
Disk Writes/sec
disk_[drive]_DiskWritesPersec
Numeric
59
Disk Reads/sec
disk_[drive]_DiskReadsPersec
Numeric
60
Disk Transfers/sec
disk_[drive]_DiskTransfersPersec
Numeric
61
Disk Read Bytes/sec
disk_[drive]_DiskReadBytesPersec
Bytes
62
Disk Write Bytes/sec
disk_[drive]_DiskWriteBytesPersec
Bytes
63
Disk Bytes/sec
disk_[drive]_DiskBytesPersec
Bytes

SQL Server Performance Counter:
#
Performance Counter
Collected As
Unit
1
Total Connections
SQL_TotalConnectionCount
Numeric
2
Total Blocked Sessions
SQL_TotalBlockedSessionCount
Numeric
3
Total User Sessions
SQL_TotalUserSessionCount
Numeric
4
Total Running User Sessions
SQL_TotalRunningUserSessionCount
Numeric
5
Total Client Machines
SQL_TotalClientMachineCount
Numeric
6
Total Running Sessions
SQL_TotalRunningSessionCount
Numeric
7
Total DBCC Sessions
SQL_TotalDBCCSessionCount
Numeric
8
Max blocking Time
SQL_Max_blocking_time_ms
Milliseconds
9
%Signal Wait
SQL_Pct_Signal_Wait
Numeric
10
Waiting Tasks
SQL_Waiting_task_count
Numeric
11
Running Tasks
SQL_Running_task_count
Numeric
12
Pending Disk I/O
SQL_Pending_disk_io_count
Numeric
13
Open Transaction
SQL_Open_transaction
Numeric
14
Tempdb free space
SQL_tempdb_free_space_mb
Megabytes
15
Tempdb used space
SQL_tempdb_used_space_mb
Megabytes
16
Tempdb current size
SQL_tempdb_current_size_mb
Megabytes
17
% tempdb used
SQL_Pct_tempdb_used
Numeric
18
Number of Deadlocks/sec
SQL_Number_of_Deadlocks_sec
Cumulative
19
Processes blocked
SQL_Processes_blocked
Numeric
20
Total Lead Blockers
SQL_TotalLeadBlockerCount
Numeric
21
Active SQL Agent Jobs
SQL_Active_Jobs
Numeric
22
User Database size
SQL_User_db_size_mb
Megabytes
23
Log size
SQL_Log_size_mb
Megabytes
24
Log used
SQL_Log_used_mb
Megabytes
25
% Log Used
SQL_Pct_Log_used
Numeric
26
Physical Memory Used by SQL Server
SQL_Physical_Memory_in_use_kb
Kilobytes
27
% Processor Time
SQL_PercentProcessorTime
Numeric
28
% Priviledged Time
SQL_PercentPrivilegedTime
Numeric
29
% User Time
SQL_PercentUserTime
Numeric
30
Working Set of SQL Server
SQL_WorkingSet
Bytes
31
Working Set Private of SQL Server
SQL_WorkingSetPrivate
Bytes
32
Read Byte/sec
SQL_Read_Byte_Per_Sec
Numeric
33
Write Byte/sec
SQL_Write_Byte_Per_Sec
Numeric
34
Page Faults/sec
SQL_Page_Faults_Per_Sec
Numeric
35
Page File Bytes
SQL_PageFileBytes
Bytes
36
Private Bytes
SQL_PrivateBytes
Bytes
37
Pool Non-paged Bytes
SQL_PoolNonpagedBytes
Bytes
38
Pool Paged Bytes
SQL_PoolPagedBytes
Bytes
39
Thread Count
SQL_ThreadCount
Numeric
40
Handle Count
SQL_HandleCount
Numeric
41
Checkpoint Pages/sec
SQL_CheckpointpagesPersec
Numeric
42
Free list stalls/sec
SQL_FreeliststallsPersec
Numeric
43
Lazy writes/sec
SQL_LazywritesPersec
Numeric
44
Page life expectancy
SQL_Pagelifeexpectancy
Seconds
45
Page lookups/sec
SQL_PagelookupsPersec
Numeric
46
Page reads/sec
SQL_PagereadsPersec
Numeric
47
Page writes/sec
SQL_PagewritesPersec
Numeric
48
Read ahead pages/sec
SQL_ReadaheadpagesPersec
Numeric
49
Full Scans/sec
SQL_FullScansPersec
Numeric
50
Index Searches/sec
SQL_IndexSearchesPersec
Numeric
51
Pages compressed/sec
SQL_PagescompressedPersec
Numeric
52
Page Splits/sec
SQL_PageSplitsPersec
Numeric
53
Table Lock Escalations/sec
SQL_TableLockEscalationsPersec
Numeric
54
Work files Created/sec
SQL_WorkfilesCreatedPersec
Numeric
55
Work tables Created/sec
SQL_WorktablesCreatedPersec
Numeric
56
Forwarded Records/sec
SQL_ForwardedRecordsPersec
Numeric
57
Extent Deallocations/sec
SQL_ExtentDeallocationsPersec
Numeric
58
Extents Allocated/sec
SQL_ExtentsAllocatedPersec
Numeric
59
Free Space Page Fetches/sec
SQL_FreeSpacePageFetchesPersec
Numeric
60
Free Space Scans/sec
SQL_FreeSpaceScansPersec
Numeric
61
Range Scans/sec
SQL_RangeScansPersec
Numeric
62
Probe Scans/sec
SQL_ProbeScansPersec
Numeric
63
Mixed page allocations/sec
SQL_MixedpageallocationsPersec
Numeric
64
Lock Average Wait Time
SQL_LockAverageWaitTimems
Milliseconds
65
Lock Requests/sec
SQL_LockRequestsPersec
Numeric
66
Lock Timeouts/sec
SQL_LockTimeoutsPersec
Numeric
67
Lock Waits/sec
SQL_LockWaitsPersec
Numeric
68
Latch Average Latch Wait Time
SQL_LatchAverageLatchWaitTimems
Milliseconds
69
Latch Waits/sec
SQL_LatchWaitsPersec
Numeric
70
Number of Super Latches
SQL_LatchNumberofSuperLatches
Numeric
71
Super Latch Demotions/sec
SQL_LatchSuperLatchDemotionsPersec
Numeric
72
Latch Super Latch Promotions/sec
SQL_LatchSuperLatchPromotionsPersec
Numeric
73
Batch Requests/sec
SQL_SQLBatchRequestsPersec
Numeric
74
SQL Compilations/sec
SQL_SQLCompilationsPersec
Numeric
75
SQL ReCompilations/sec
SQL_SQLReCompilationsPersec
Numeric
76
Auto Param Attempts/sec
SQL_AutoParamAttemptsPersec
Numeric
77
Failed Auto Params/sec
SQL_FailedAutoParamsPersec
Numeric
78
Forced Parameterizations/sec
SQL_ForcedParameterizationsPersec
Numeric
79
Safe Auto Params/sec
SQL_SafeAutoParamsPersec
Numeric
80
Un safe Auto Params/sec
SQL_UnsafeAutoParamsPersec
Numeric
81
SQL Attention rate
SQL_ERR_SQLAttentionrate
Numeric
82
Errors/sec
SQL_ERR_ErrorsPersec
Numeric
83
Backup Restore Throughput/sec
SQL_BackupPerRestoreThroughputPersec
Numeric
84
Bulk Copy Throughput/sec
SQL_BulkCopyThroughputPersec
Bytes
85
DBCC Logical Scan Bytes/sec
SQL_DBCCLogicalScanBytesPersec
Bytes
86
Log Bytes Flushed/sec
SQL_LogBytesFlushedPersec
Bytes
87
Log Flushes/sec
SQL_LogFlushesPersec
Numeric
88
Log Flush Waits/sec
SQL_LogFlushWaitsPersec
Numeric
89
Transactions/sec
SQL_TransactionsPersec
Numeric
90
Granted Workspace Memory
SQL_GrantedWorkspaceMemoryKB
Kilobytes
91
Lock Memory
SQL_LockMemoryKB
Kilobytes
92
Maximum Workspace Memory
SQL_MaximumWorkspaceMemoryKB
Kilobytes
93
Memory Grants Outstanding
SQL_MemoryGrantsOutstanding
Numeric
94
Memory Grants Pending
SQL_MemoryGrantsPending
Numeric
95
Optimizer Memory
SQL_OptimizerMemoryKB
Kilobytes
96
Connection Memory
SQL_ConnectionMemoryKB
Kilobytes
97
Cache Memory
SQL_SQLCacheMemoryKB
Kilobytes
98
Target Server Memory
SQL_TargetServerMemoryKB
Kilobytes
99
Total Server Memory
SQL_TotalServerMemoryKB
Kilobytes
100
% Memory Used by SQL Server
SQL_MemoryPctUsed
Numeric
101
Buffer Free
SQL_BufferFreeKB
Kilobytes
102
Buffer Used
SQL_BufferUsedKB
Kilobytes
103
% Buffer Used
SQL_BufferPctUsed
Numeric
104
Active Temp Tables
SQL_ActiveTempTables
Numeric
105
Transactions
SQL_Transactions
Numeric
106
Temp Tables For Destruction
SQL_TempTablesForDestruction
Numeric
107
Lock waits
SQL_WAIT_Lockwaits
Milliseconds
108
Log Buffer waits
SQL_WAIT_LogBufferwaits
Milliseconds
109
Log Write waits
SQL_WAIT_LogWritewaits
Milliseconds
110
Memory Grant Queue waits
SQL_WAIT_MemoryGrantQueuewaits
Milliseconds
111
Network IO waits
SQL_WAIT_NetworkIOwaits
Milliseconds
112
Non-Page Latch waits
SQL_WAIT_NonPageLatchwaits
Milliseconds
113
Page IO Latch waits
SQL_WAIT_PageIOLatchwaits
Milliseconds
114
Page Latch waits
SQL_WAIT_PageLatchwaits
Milliseconds
115
Thread Safe memory Objects waits
SQL_WAIT_ThreadSafememoryObjectswaits
Milliseconds
116
Transaction Ownership waits
SQL_WAIT_TransactionOwnershipwaits
Milliseconds
117
Wait for the Worker
SQL_WAIT_WaitfortheWorker
Milliseconds
118
Workspace Synchronization waits
SQL_WAIT_WorkspaceSynchronizationwaits
Milliseconds
119
Bytes Received from Replica/sec
SQL_AON_BytesReceivedfromReplicaPersec
Bytes
120
Bytes Sent to Replica/sec
SQL_AON_BytesSenttoReplicaPersec
Bytes
121
Bytes Sent to Transport/sec
SQL_AON_BytesSenttoTransportPersec
Bytes
122
Flow Control/sec
SQL_AON_FlowControlPersec
Milliseconds
123
Flow Control Time ms/sec
SQL_AON_FlowControlTimemsPersec
Numeric
124
Receives from Replica/sec
SQL_AON_ReceivesfromReplicaPersec
Numeric
125
Sends to Replica/sec
SQL_AON_SendstoReplicaPersec
Numeric
126
Sends to Transport/sec
SQL_AON_SendstoTransportPersec
Numeric
127
Resent Messages/sec
SQL_AON_ResentMessagesPersec
Numeric
128
Average Time/Wait
SQL_AON_AverageTimePerWait
Milliseconds
129
Transaction Delay
SQL_AON_TransactionDelay
Milliseconds
130
Mirrored Write Transactions/sec
SQL_AON_MirroredWriteTransactionsPersec
Numeric
131
File Bytes Received/sec
SQL_AON_REP_FileBytesReceivedPersec
Bytes
132
Log Bytes Received/sec
SQL_AON_REP_LogBytesReceivedPersec
Bytes
133
Redo blocked/sec
SQL_AON_REP_RedoblockedPersec
Numeric
134
Log Remaining For Undo
SQL_AON_REP_LogRemainingForUndo
Bytes
135
Log Send Queue
SQL_AON_REP_LogSendQueue
Bytes
136
Redo Bytes Remaining
SQL_AON_REP_RedoBytesRemaining
Bytes
137
Total Log Requiring Undo
SQL_AON_REP_TotalLogRequiringUndo
Bytes
138
SQL Query Response Time
SQL_Response_Time_ms
Milliseconds
139
Avg. Execution Time
SQL_Avg_Excecution_Time_ms
Milliseconds
140
Avg. Worker Time
SQL_AVG_Worker_Time_ms
Milliseconds


Offline SQL Server installation on Redhat/CentOS

$
0
0

The following step-by-step method can be used to install SQL Server 2017 on the latest Redhat or CentOS. Please take a moment to review the Microsoft documentation for more detailed information. Please also note that the Redhat (paid) and CentOS (non-paid) distributions are identical in terms of execution and package deployment.


Convenience tools:
Download and use the following open source tools while working within the Linux/Unix environment.

Linux Terminal Emulator: Putty/Kitty (https://putty.org/)
SSH File transfer: FileZila (https://filezilla-project.org/)

We will be installing SQL Server 2017 on the CentOS Server (https://www.centos.org/) as a root user. Where

CentOS 7.4 Server: linux01 (192.168.0.155)
FQDN: linux01.myhome.org

Step-by-step method to install SQL Server 2017 on Linux:

1. Download all the packages for the Redhat Linux distribution from the following link:

Following are the packages for Redhat/CentOS Linux:

mssql-server-14.0.3022.28-2.x86_64.rpm
mssql-server-fts-14.0.3022.28-2.x86_64.rpm
mssql-server-ha-14.0.3022.28-2.x86_64.rpm
mssql-server-is-14.0.1000.169-1.x86_64.rpm
mssql-tools-14.0.5.0-1.x86_64.rpm
msodbcsql-13.1.6.0-1.x86_64.rpm
unixODBC-2.3.1-11.el7.x86_64.rpm

2. On the Linux server, create a folder such as "sqlpkg" in /home directory
mkdir /home/sqlpkg

3. Move all the packages from Windows to the /home/sqlpkg folder in the Linux Server:
use FileZila to transfer the files.

4. Use Putty or Kitty as the Linux terminal emulator from the Windows desktop:
log on to the Linux server - linux01 (192.168.0.155).

5. Go to the package folder:
cd /home/sqlpkg

6. Install the database engine package:
sudo yum localinstall mssql-server-14.0.3022.28-2.x86_64.rpm

7. Run the setup to complete the installation and respond to the on screen prompt:
sudo /opt/mssql/bin/mssql-conf setup

8. Choose the SQL Server Edition option that needs to be configured.

9. Enter the SQL Server sa password – the password should be complex enough.

10. Restart the SQL Server Service and check the status:
systemctl restart mssql-server.service

11. Check the SQL Server Service status:
systemctl status mssql-server

12. Enable SQL Server Agent:
sudo /opt/mssql/bin/mssql-conf set sqlagent.enabled true

13. Restart and check the SQL Server Service status:
sudo systemctl restart mssql-server
systemctl status mssql-server

14. Firewall port configuration:
sudo firewall-cmd --zone=public --add-port=1433/tcp --permanent
sudo firewall-cmd --reload

15. Environment: PATH environment variable needs to be configured:
echo 'export PATH="$PATH:/opt/mssql-tools/bin"'>> ~/.bash_profile
echo 'export PATH="$PATH:/opt/mssql-tools/bin"'>> ~/.bashrc
source ~/.bashrc

16. Install the sql-tools:  execute the following commands in a sequence.
sudo yum localinstall unixODBC-2.3.1-11.el7.x86_64.rpm
sudo yum localinstall msodbcsql-13.1.6.0-1.x86_64.rpm
sudo yum localinstall mssql-tools-14.0.5.0-1.x86_64.rpm

17. Test the SQL Server installation:
sqlcmd -S linux01 -U SA -P '<SAPassword>'
sqlcmd -S localhost -U SA -P '<SAPassword>'


Some Screenshots:


Using FileZila to transfer SQL Server 2017 packages to the Linux Server:

SQL Server packages on the Linux Server (/home/sqlpkg):


SQL Server Database Engine Installation:


Choosing SQL Server Engine Edition:


Connecting SQL Server on Linux using SSMS:

Viewing all 94 articles
Browse latest View live